Prior Knowledge for Deciphering GDP Dashboards
- Last Updated:
Dashboard on quarterly flash estimates of GDP and The Dashboard .
Table of Contents
- 1. Basic Concept of GDP
- 2. Types of Statistical Data and Publication Dates
- 3. Interpretation of Figures
- 4. FAQs
- 5. Contact
1. Basic Concept of GDP
Principle of equivalent of three aspects
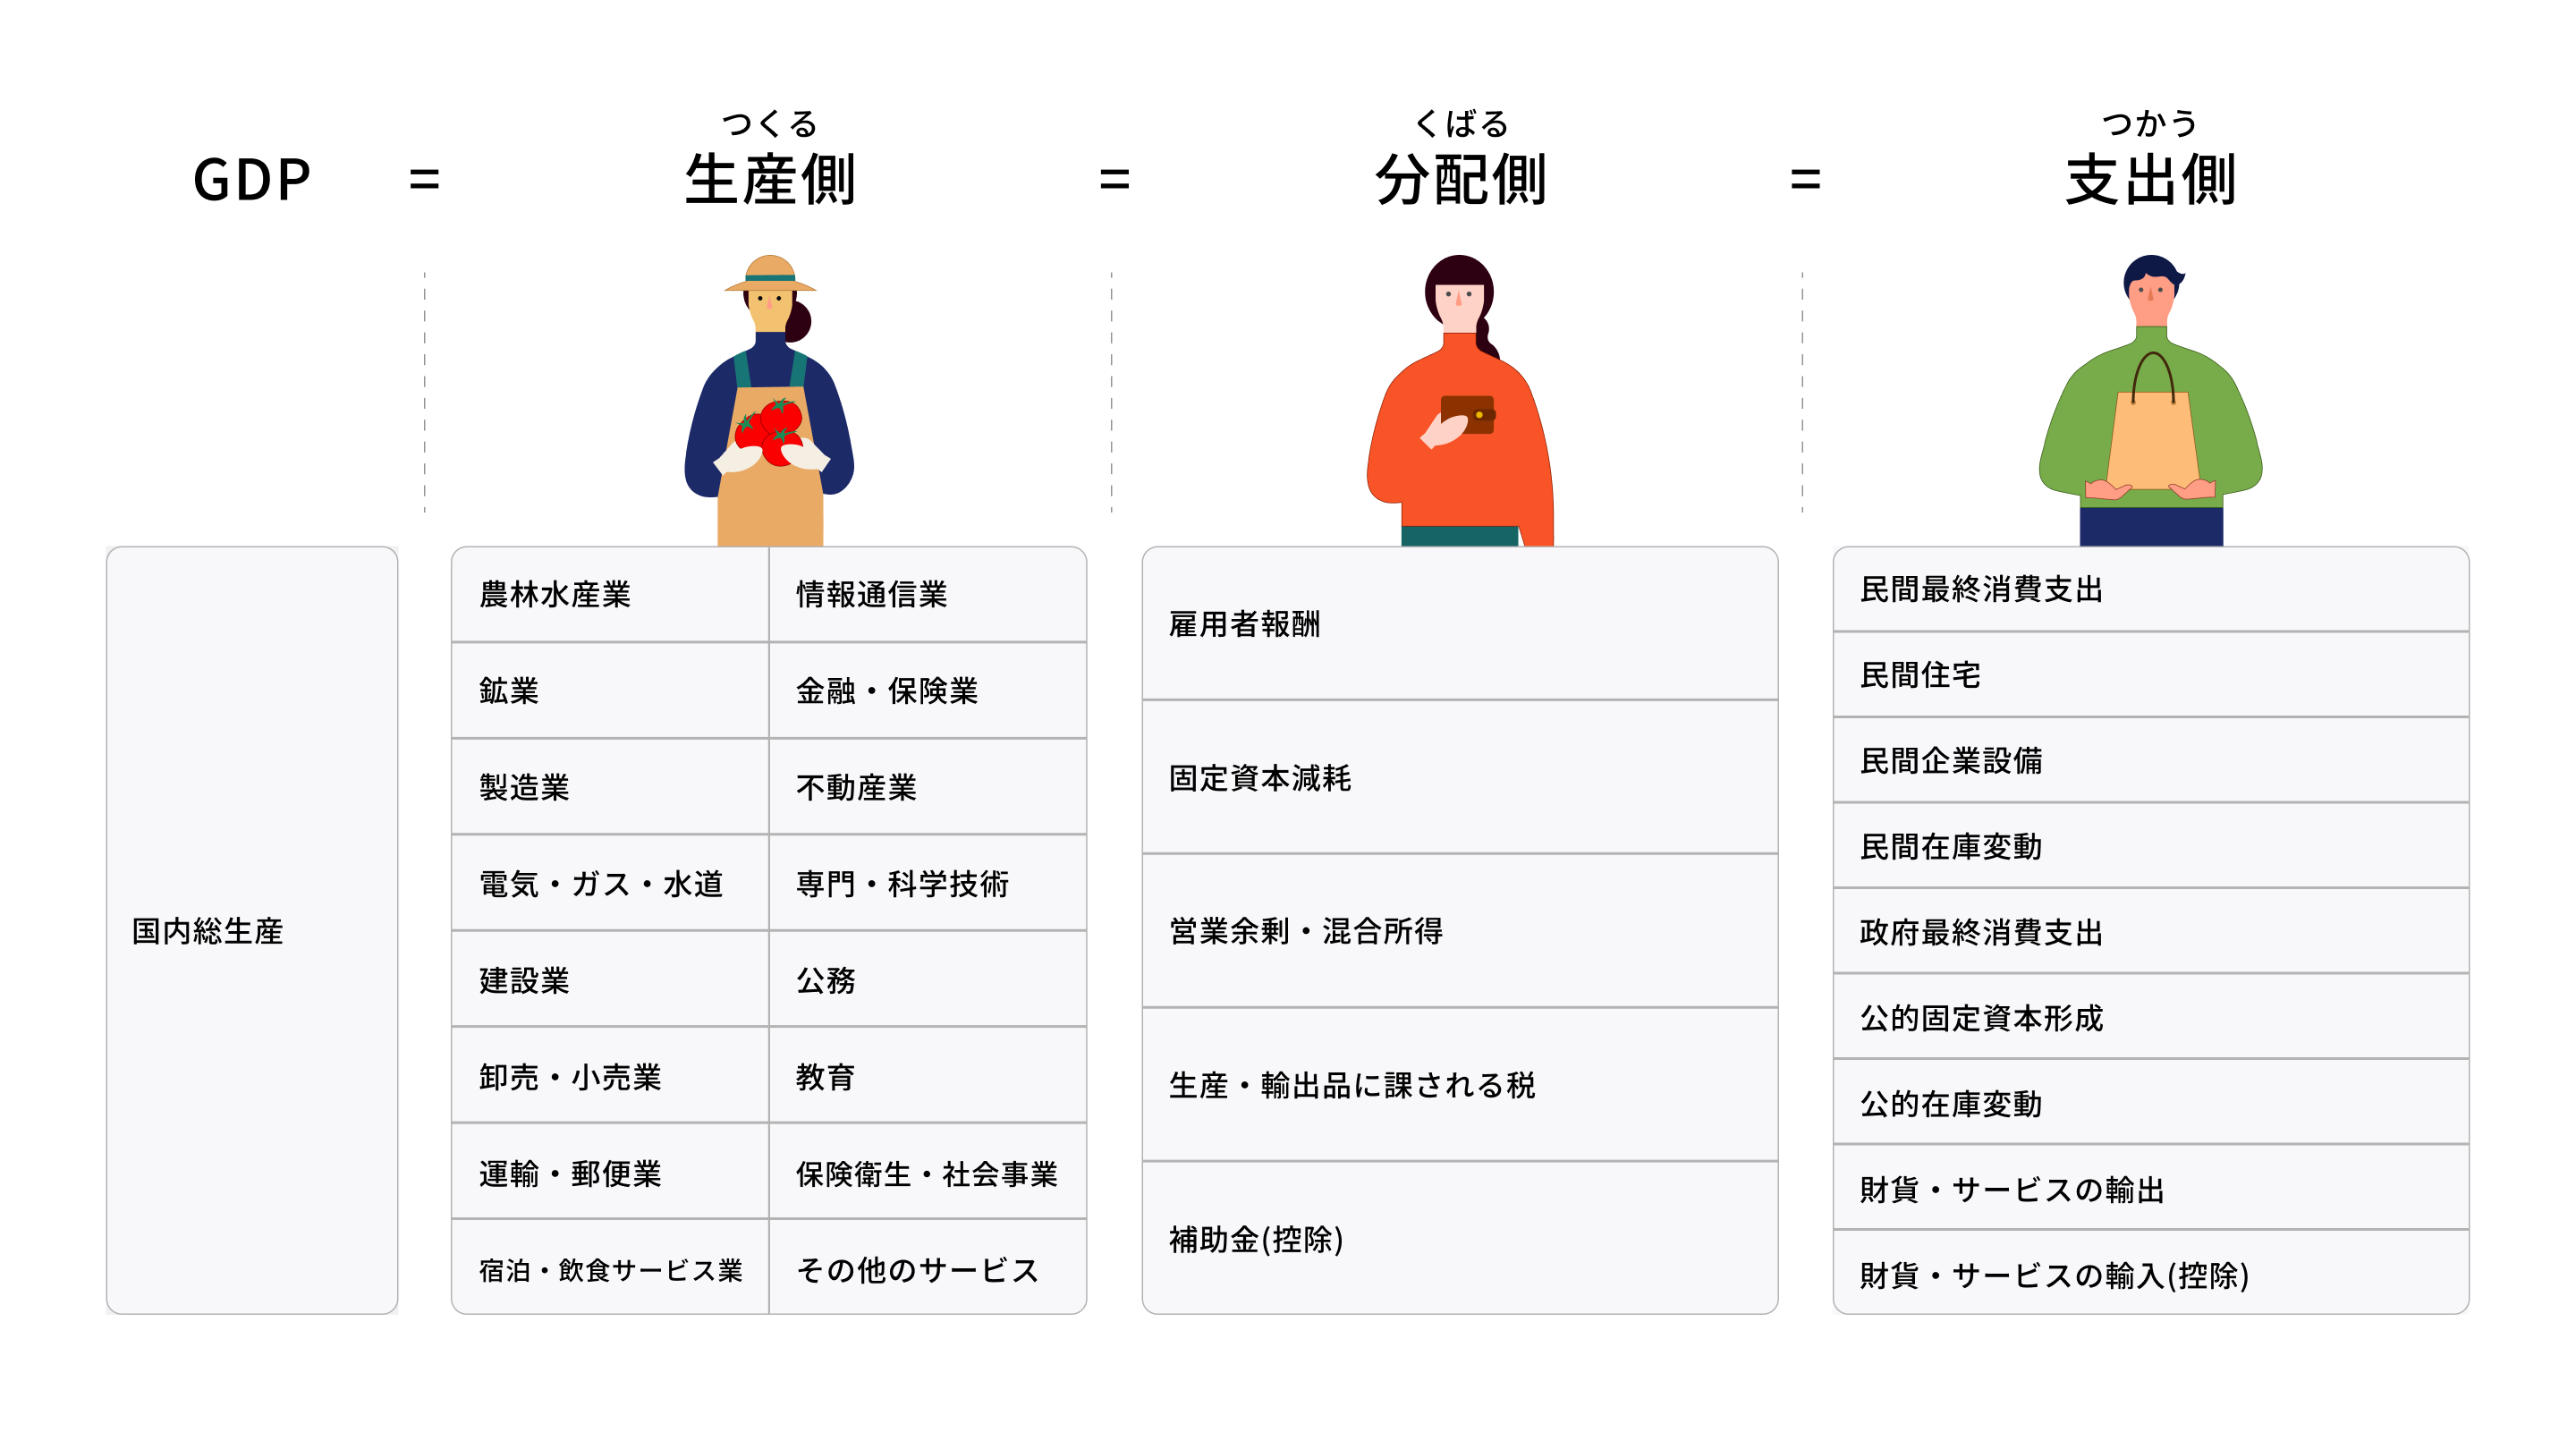
Gross Domestic Product (GDP) is the total value added domestically and can be calculated from three aspects: "production," "expenditure," and "distribution." GDP calculated from these three aspects is conceptually identical and is called "trifacial equivalent." In reality, however, it may not be exactly identical due to differences in basic statistics and estimation methods.
The GDP dashboard covers data from the "production side," "distribution side," and "expenditure side."
Differences among producers, distributors, and spenders
Production side
The total value of goods and services produced in Japan less the intermediate inputs such as raw materials used for production. It can be subdivided by industry such as "agriculture, forestry and fisheries", "mining" and "manufacturing".
*For specific industry classifications, please refer to Appendix 2-1, "Classifications by Economic Activity in the 2015 Base Year" of "Japan's National Accounts in Response to the 2015 SNA (2008 Base Year Version)," published in "Regarding the 2015 Base Year Revision of the 2015 System of National Accounts (Cabinet Office)," . 2015
Distribution side
It shows how the added value created by production activities is distributed as income. It consists of items such as "employee compensation" and "fixed capital consumption".
Expenditure side
It looks at how the goods and services produced are ultimately used. It can be subdivided by demand items such as "private final consumption expenditure" and "public fixed capital formation".
*Detailed explanations of the demand-components of the expenditure-side GDP are summarized in "Explanation of the demand-components covered by the GDP dashboard ".
2. Types of statistical data and release dates
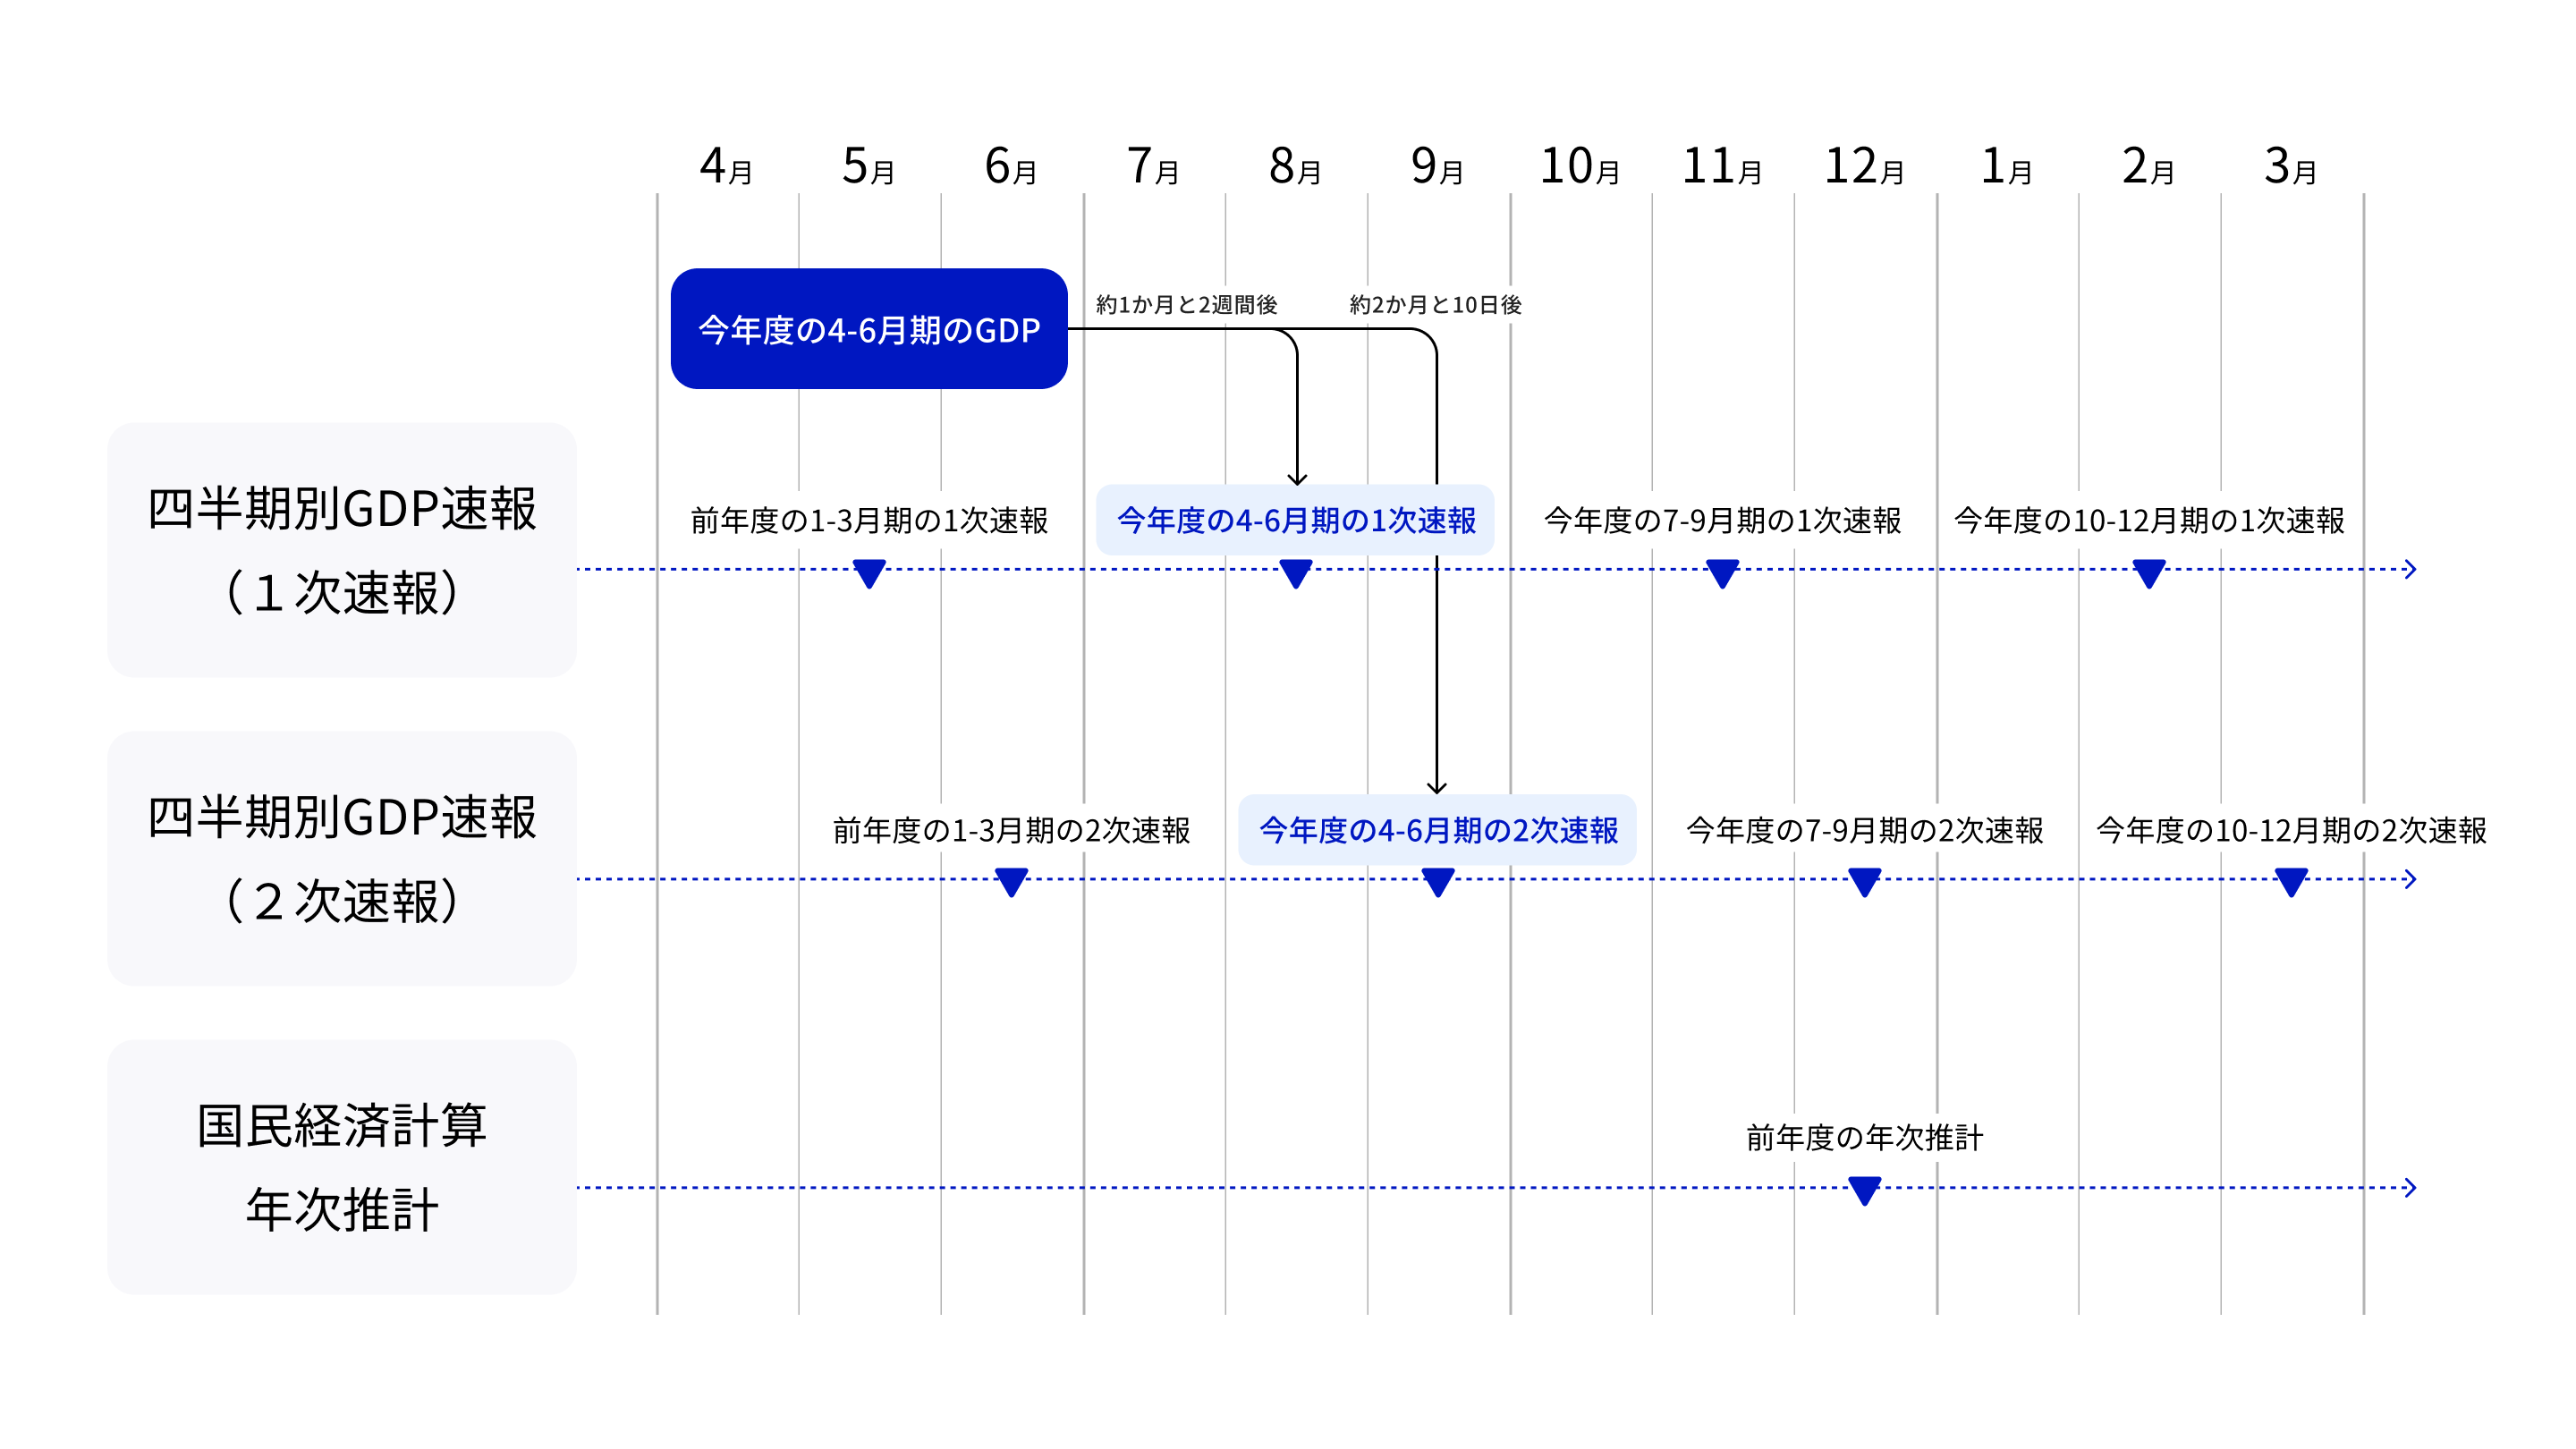
The System of National Accounts broadly releases two sets of results: "Preliminary Quarterly GDP Estimates" and "Annual Estimates." Preliminary Quarterly GDP Estimates, also known as Quarterly Estimates (QE), are released by Cabinet Office twice quarterly and eight times annually. Annual Estimates are usually released in stages from around December. For details, please see Release Schedule (Cabinet Office) .
*The data updated in the quarterly bulletins and annual estimates cover the full period since 1994.
Quarterly GDP Preliminary Report (First Preliminary Report, Second Preliminary Report)
First preliminary report
It is a bulletin to analyze economic activity for a quarter, and the time of publication is about one month and two weeks after the quarter ends.
Second preliminary report
After the release of the first preliminary report, the first estimate will be revised based on newly available data. The release date is approximately two months and ten days after the end of the quarter.
Annual estimate
Estimates are based on detailed annual basic statistics. They are published after the end of the year in which the fiscal year ends.
Dashboard Update Timing
- Dashboard on quarterly flash estimates of GDP will be updated later in the day following the release of the quarterly flash estimates.
- The Dashboard on Annual Estimates of GDP is updated every year around March after the publication of the annual estimates.
3. How to read the data
What is seasonal adjustment?
Prices and household consumption are subject to seasonality, and it is not possible to compare figures at different times of the year as they are. Therefore, the quarterly flash report is processed as a seasonal adjustment excluding seasonality. The published quarterly seasonal adjustment series (actual amounts) are annualized by multiplying the quarterly values by four. This makes it possible to compare the calendar year values and fiscal year values in the annual estimate.
The preliminary quarterly GDP Index dashboard provides the most closely watched seasonally adjusted series of GDP and breakdown demand components. For the "original series," before seasonal adjustments, see the Preliminary Quarterly GDP Index (Cabinet Office) .
Nominal values, real values, and deflators
The relationship between the nominal value, real value and deflator is "nominal value = real value × deflator".
Nominal value
Nominal value is the value assessed at the current price at which it is actually traded in the market.
It is characterized by rising and falling values due to price fluctuations as well as changes in the quantity spent and produced.
Real value
The real value is determined by setting a base year and eliminating the effect of price fluctuations from that year.
It should be noted that while the simple sum of the sub-items matches the top item (such as GDP) in nominal terms, it does not necessarily match in real terms. For more information, see Chaining Frequently Asked Questions (Cabinet Office) .
Deflator
The indicator representing price fluctuations of goods and services is called the deflator.
How to read the contribution
What You Can Learn from Contributions
When looking at the GDP growth rate, looking at the degree of contribution, we can see which items had a major impact on the GDP growth rate, for example, whether private final consumption expenditure or public fixed capital formation boosted the GDP growth.
The total contribution of each item corresponds to the GDP growth rate, and the larger the impact on the GDP growth rate, the greater the contribution.
Illustration
When GDP increases from 500 trillion yen to 505 trillion yen, if the previous year's figure is 100, this year's figure will be 101, which is a 1.0 percent increase from the previous year.
If the demand component in the breakdown increased by 1.0 percent from A to C and decreased by 2.0 percent from D, A to C would have added 1.0 percentage points to the GDP growth rate, while C would have added 2.0 percentage points to the GDP growth rate, showing that A to C, not any one demand component, contributed about the same amount to the GDP growth rate.
For the method of calculating the contribution of real values, please refer to "Chapter 8: Deflators and Real Values" in the "Guide to National Accounts Estimation Methods (Annual Estimates), 2020 Standard Edition" published in Methods of Compiling Statistics (Cabinet Office) . 2020
4. Frequently Asked Questions
If you have any questions about GDP, please visit FAQ: Economic and Social Research Institute (Cabinet Office) .
5. Contact Information
- National Accounts Department, Cabinet Office Economic and Social Research Institute
- Telephone: (03) 5253 (2111) (Ojiro)
- Online: Cabinet Office Common Opinion Registry System (Cabinet Office)