Dashboard and Data Catalog on Economy, Finance, Population and Livelihood (by Prefecture)
- Last Updated:
Since 2016, Cabinet Office has been operating the Economic, Fiscal, and Livelihood Indicators "MIERUKA (Visualization)" Database (Cabinet Office) , which allows users to download various data-related indicators, in order to visualize them and use them for more detailed analysis and verification.
In order to further promote data-based policymaking, Cabinet Office and Digital Agency worked together to develop a new "Dashboard and Data Catalog on Economy, Finance, Population and Livelihood (by Prefecture)." In response to requests from users of the "visualization" database, renewal policies were established to improve operability and searchability, and to support a variety of analysis methods.
We are conducting a survey to improve this dashboard. Please use the form below to send us your opinions.
Notice
- December 19, 2025
- Data Updated
Table of Contents
- Classification of Indicators
- Dashboard on Economy, Finance, Population and Livelihood (by Prefecture)
- Data Catalog
- Solicitation of Opinions
- Related Information
- Points to consider
- Contact Information
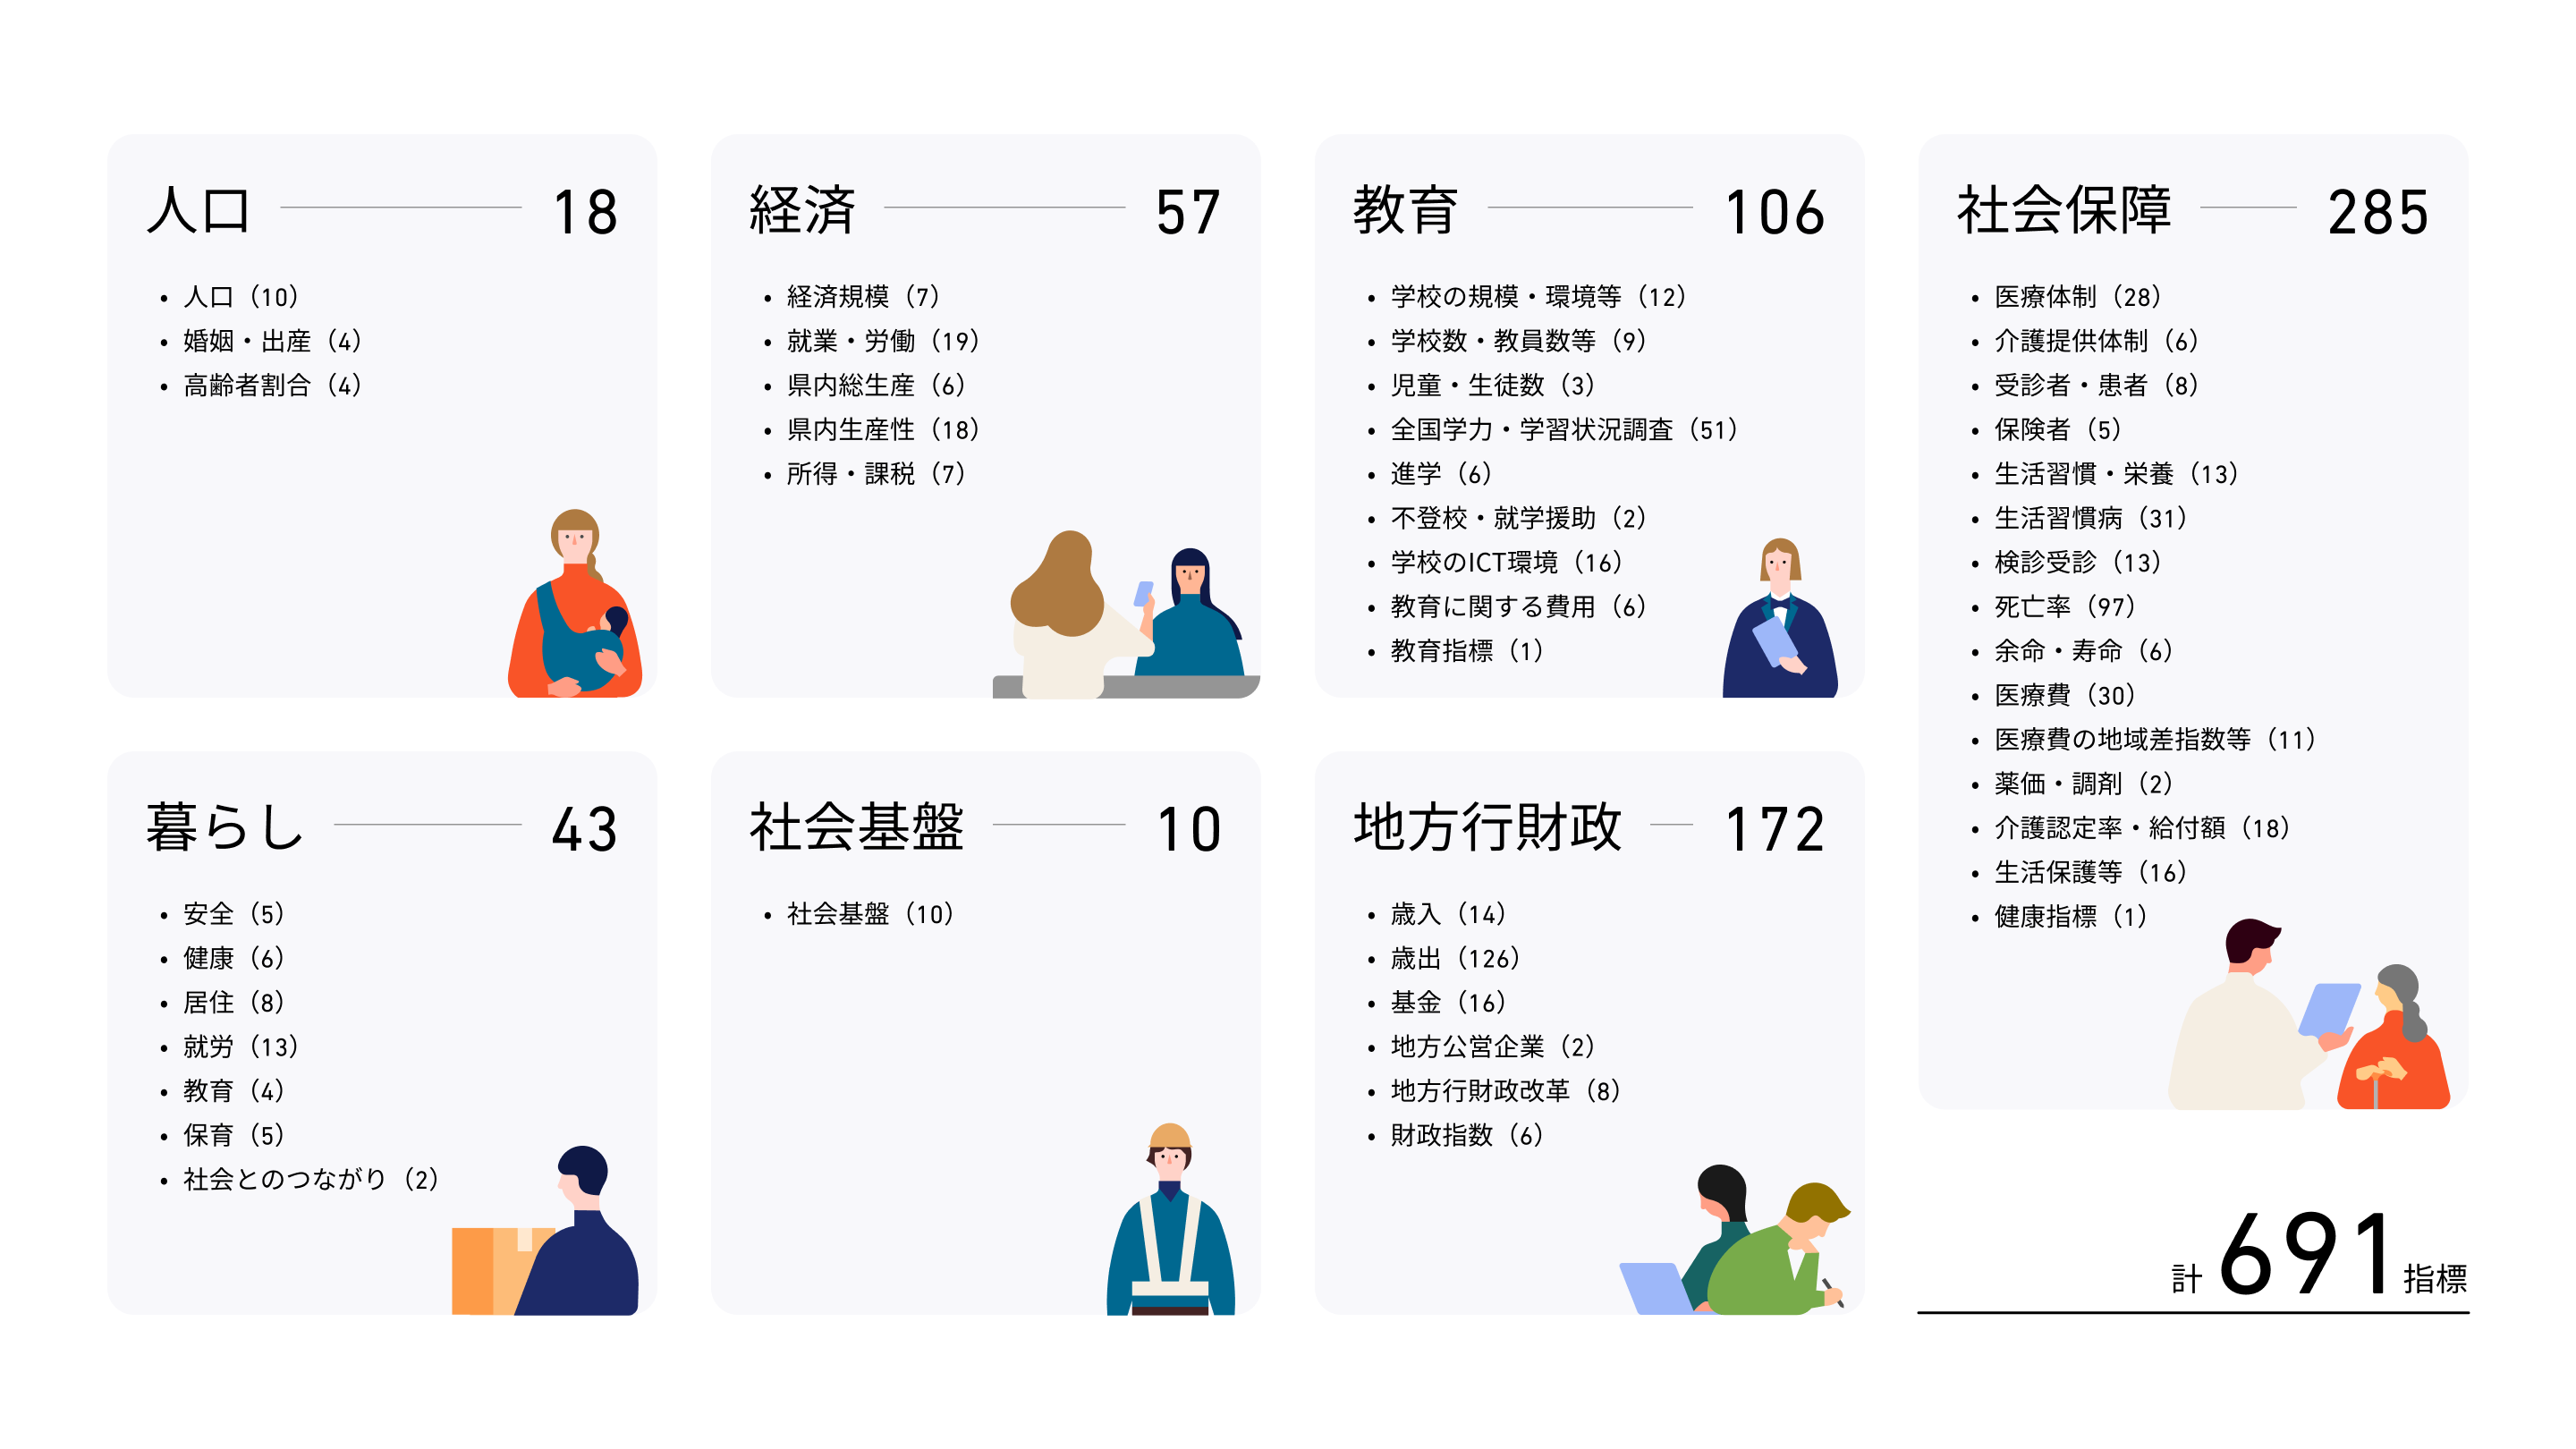
1. Classification of Indicators
The dashboard on economy, finance, population and livelihood (for each prefecture) organizes about 700 indicators into 7 major categories and 62 minor categories.
- Population: Population, marriage / birth, elderly ratio, etc.
- Economy: Gross prefectural product, employment and labor, income and taxation, etc.
- ICT: Number of schools and teachers, educational environments of schools, etc.
- Social security: Medical system, medical expenses, medical examination rate, etc.
- Living: Safety, housing, etc.
- Social Infrastructure: Social Infrastructure
- Local public administration and finance: funds, expenditures and revenues, etc.
2. Dashboard on economy, finance, population and livelihood (for each prefecture)
Look at the index data
"Looking at Indicator Data" describes the data type, data recording period, and data source.
First of all, please check if there are indicators that can be used for policy planning and analysis in business.
Look at one indicator by prefecture
Various indicators can be displayed in the form of maps and graphs, and differences, characteristics, and trends by prefecture can be confirmed in the data.
To examine the relationship between the two indicators
You can select any two indicators and check the distribution and correlation of the indicators in a scatter diagram.
A function that displays only indicators that are highly correlated with the indicator you chose for the Y-axis makes it easier to find and analyze relevant indicators.
Look at the changes in the four indicators
Various indicators can be viewed in chronological order by listing up to four items. By displaying two regions side by side, trends and differences between regions can be confirmed.
3. Data Catalog
Copying and Using Data from One Indicator
You can copy and use the data in the dashboard.
Full-Screen View of "Copy and Use Data from One Metric" Dashboard
, which downloads multiple indicators from
You can also download multiple metrics at once.
Please set the indicator, prefecture and the period of the acquired data and download it.
4. Request for opinions
We are conducting a survey to improve this dashboard. Please use the form below to send us your opinions.
5. Related Materials
Viewing and Navigating the Dashboard
The detailed operation method of the dashboard related to economy, finance, population and living (for each prefecture) is explained in video.
Economic, Financial, Population and Livelihood (by City) Dashboard
In addition to the data by prefecture, we also publish the data by municipality as a dashboard.
Renewal policy for the visualization database
We have also published a policy for the renewal of the "visualization" database.
6. Important Points
Data:
- Various kinds of date used for the dashboard are collected in Cabinet Office.
- These indicators can be downloaded from , which downloads multiple indicators from at once.
- We plan to update the various dashboard numbers on a regular basis.
True or false information
For true-or-false information about the figures in this dashboard, please refer to True-or-false Information: Economy, Finance, Population and Livelihood (for each prefecture) Dashboard .
7. Contact Information
Inquiries about the data
Please send any questions or ideas to "Regarding opinions and requests regarding the Japan Dashboard (Dashboard on Economy, Finance, Population and Livelihood) (Cabinet Office) ".