Economic, Financial, Population and Livelihoods (by City) Dashboard and Data Catalog
Since 2016, Cabinet Office has been operating the Economic, Fiscal, and Livelihood Indicators "MIERUKA (Visualization)" Database (Cabinet Office) , which allows users to download various data-related indicators, in order to visualize them and use them for more detailed analysis and verification.
In order to further promote data-based policymaking, Cabinet Office and Digital Agency worked together to develop a new "Dashboard and Data Catalog on Economy, Finance, Population and Livelihood (by Municipality)." In response to requests from users of the "visualization" database, renewal policies were established to improve operability and searchability and to support a variety of analysis methods.
We are conducting a survey to improve this dashboard. Please use the form below to send us your opinions.
Notice
- December 19, 2025
- Municipal data of statistics related to economy, finance, population and livelihood was released.
Table of Contents
- Classification of Indicators
- Economic, Financial, Population and Livelihood (by City) Dashboard
- Data Catalog
- Solicitation of Opinions
- Related Documents
- Points to consider
- Contact Information
1. Classification of Indicators
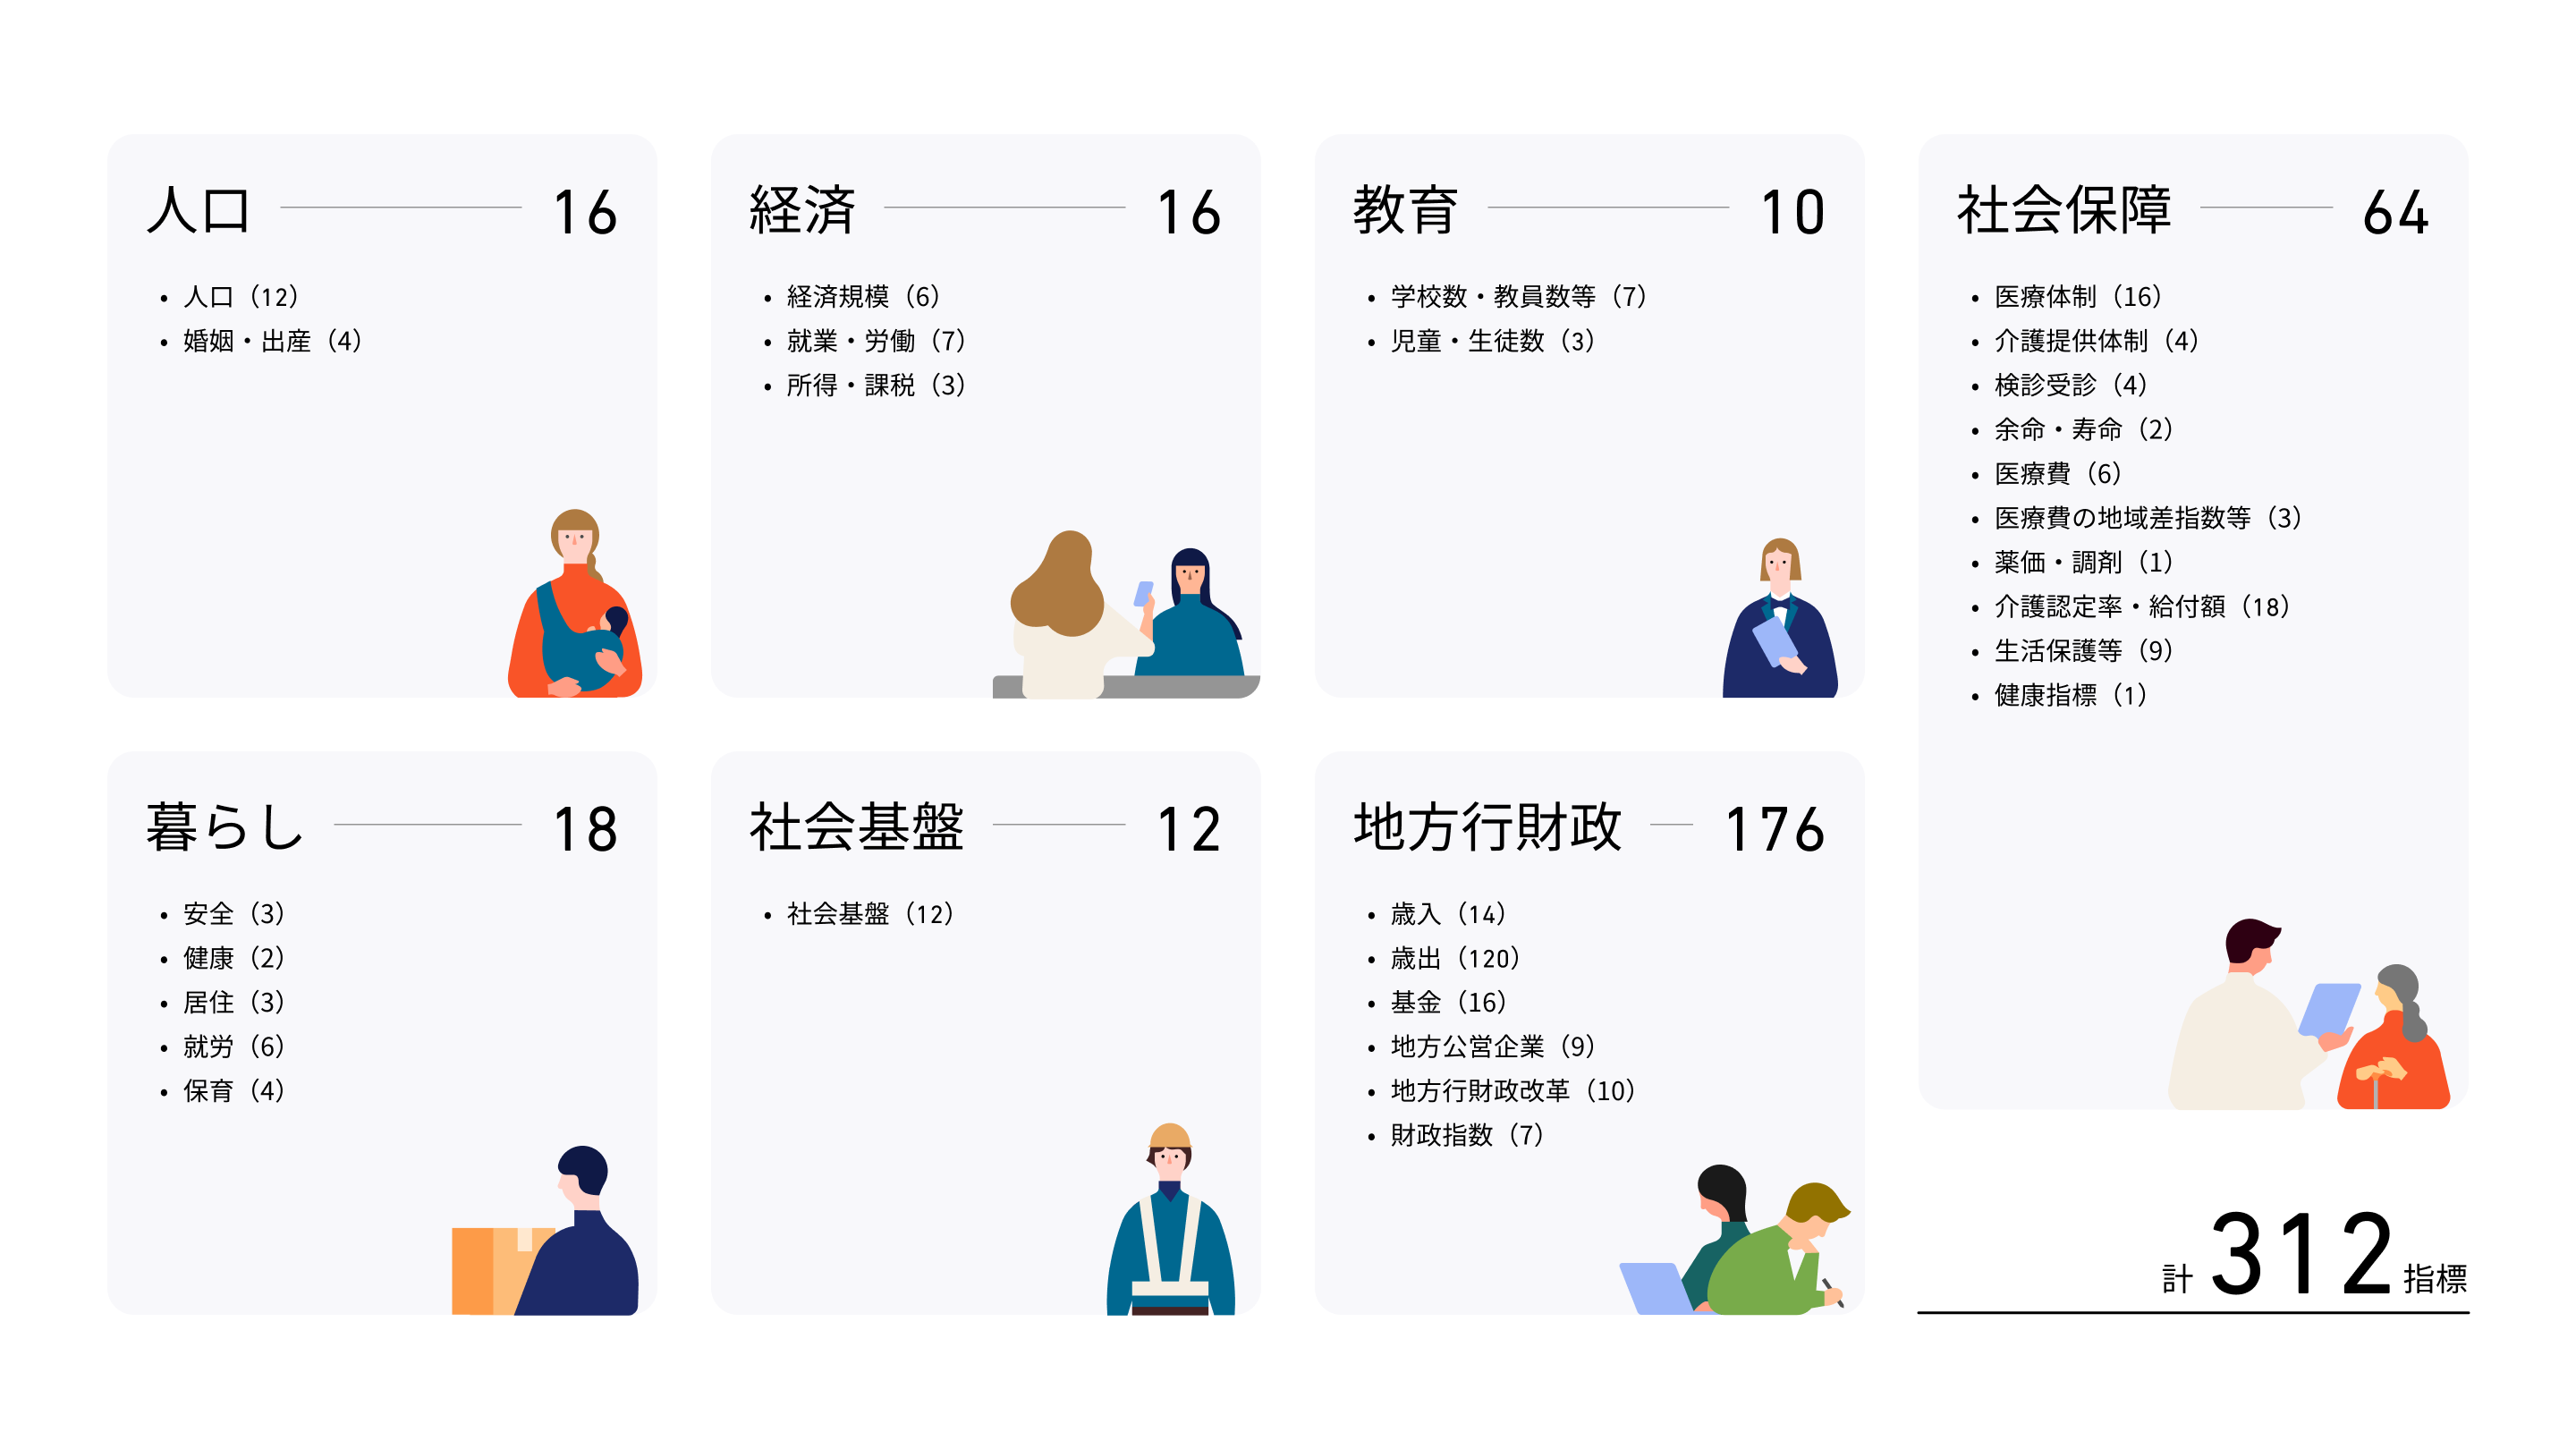
The dashboard on the economy, finance, population and livelihood (by municipality) organizes about 300 indicators into seven broad categories.
- Population: Population, marriage, birth, etc.
- Economy: Employment and labor, income and taxation, etc.
- Education: Number of schools, teachers, etc.
- Social security: Medical system, medical expenses, medical examination rate, etc.
- Living: Safety, housing, etc.
- Social Infrastructure: Social Infrastructure
- Local public administration and finance: funds, expenditures and revenues, etc.
2. Dashboard on economy, finance, population and livelihood (by municipality)
Look at the index data
"Looking at Indicator Data" describes the data type, data recording period, and data source.
First of all, please check if there are indicators that can be used for policy planning and analysis in business.
Map one of the indicators
A variety of indicators can be displayed on the map, and the differences, characteristics, and trends of each municipality can be confirmed in the data.
You can also view the number of indicators and the rate of change across multiple regions (for example, Tokyo and Kanagawa Prefecture).
Compare one indicator with another
You can compare the figures of the selected municipal indicators with similar and voluntary organizations.
- Comparison with similar organizations
- Government-ordinance-designated cities, core cities, and special wards are automatically compared with similar local government classifications.
- General cities and towns and villages are automatically compared with groups with similar population size, aging rate, and financial capability index.
- Comparison with voluntary organizations
- Comparison with an organization category that meets the conditions set by the user for municipality category, population size, aging rate, and financial capability index
*Each indicator (population size, aging rate, financial capability index), which is a condition for similar organizations, is based on the latest data for each indicator.
*The Financial Capability Index is a financial indicator of local governments calculated as the three year average of the value obtained by dividing the "standard amount of financial revenue" of local governments by the "standard amount of financial demand." If the index is 1.00 or higher, it is classified as a "local government that does not receive ordinary local allocation tax (a local government that conducts financial administration without receiving ordinary local allocation tax, which is part of the national local allocation tax, for the purpose of correcting imbalances in revenue sources among local governments)," and if the index is less than 1.00, it is classified as a "local government that provides ordinary local allocation tax."
To examine the relationship between the two indicators
You can select any two indicators and check the distribution and correlation in a scatter diagram.
You can narrow down the municipalities to be displayed in the scatter graph by municipality division, total population, aging rate, etc.
Look at the changes in the four indicators
Various indicators are arranged up to four items and can be viewed in time series.
By viewing two regions side by side, you can see trends and differences between regions.
3. Data Catalog
, which downloads multiple indicators from
You can download multiple metrics at once.
Set the indicator, the municipality and the period of the acquired data and download it.
Full-Screen View of "Download Multiple Metrics" Dashboard
4. Solicitation of Opinions
We are conducting a survey to improve this dashboard. Please use the form below to send us your opinions.
5. Related Materials
Viewing and Navigating the Dashboard
The detailed operation method of the dashboard related to economy, finance, population and living (by municipality) is explained in video.
Dashboard on Economy, Finance, Population and Livelihood (by Prefecture)
In addition to the data for each municipality, we also publish data for each prefecture as a dashboard.
Renewal policy for the visualization database
We have also published a policy for the renewal of the "visualization" database.
6. Important Points
Data:
- Various kinds of date used for the dashboard are collected in Cabinet Office.
- These indicators can be downloaded from , which downloads multiple indicators from at once.
- We plan to update the various dashboard numbers on a regular basis.
- The map displayed in the "See one indicator on a map" dashboard is created by processing Digital National Land Information (administrative district information) (Ministry of Land, Infrastructure, Transport and Tourism) .
- For the convenience of the system, the map mechanically shows islands over a certain area.
True or false information
For true-or-false information about the date in this dashboard, see True-or-False Information: Economy, Finance, Population and Livelihood (by City) Dashboard .
7. Contact Information
Inquiries about the data
For questions or ideas, please contact , Cabinet Office, for opinions and requests regarding the "Japan Dashboard (Dashboard on Economy, Finance, Population and Livelihood)".