This page has been translated using TexTra by NICT. Please note that the translation may not be completely accurate.If you find any mistranslations, we appreciate your feedback on the "Request form for improving the automatic translation ".

Be aware of the numbers

Although Digital Agency is a new organization, we have been steadily increasing our recruitment of new graduates.
We will introduce the results of recruitment so far, the attributes of the staff, and the figures related to the working style after entering the office.

Thumbnail image of a data visualization that combines a pie chart and bar chart

Table of Contents

Know the employment record and attributes

We will introduce the results of hiring new graduates in Digital Agency and the diverse backgrounds of our employees.
Unless otherwise specified, each item in this section is prepared based on the data of employees who joined the Agency as new graduates.
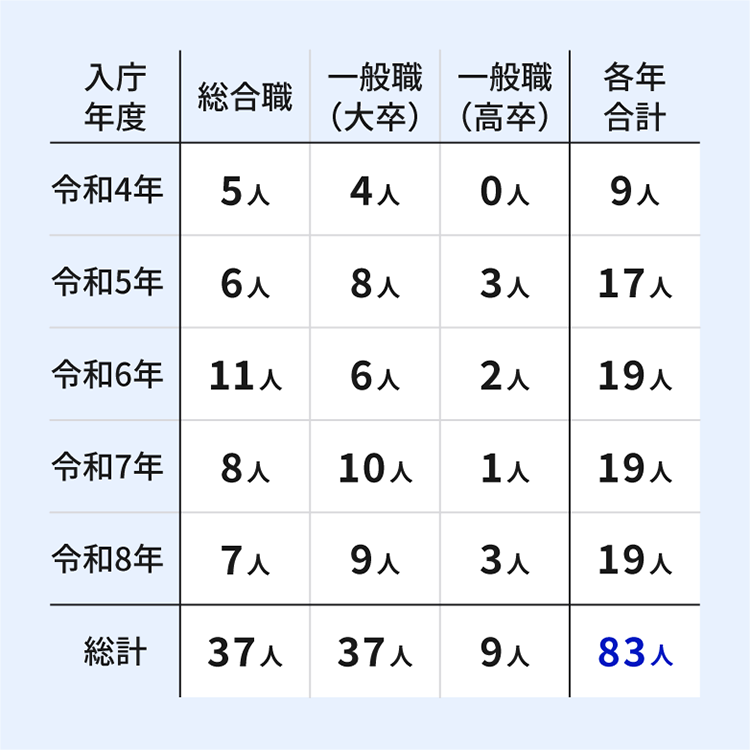
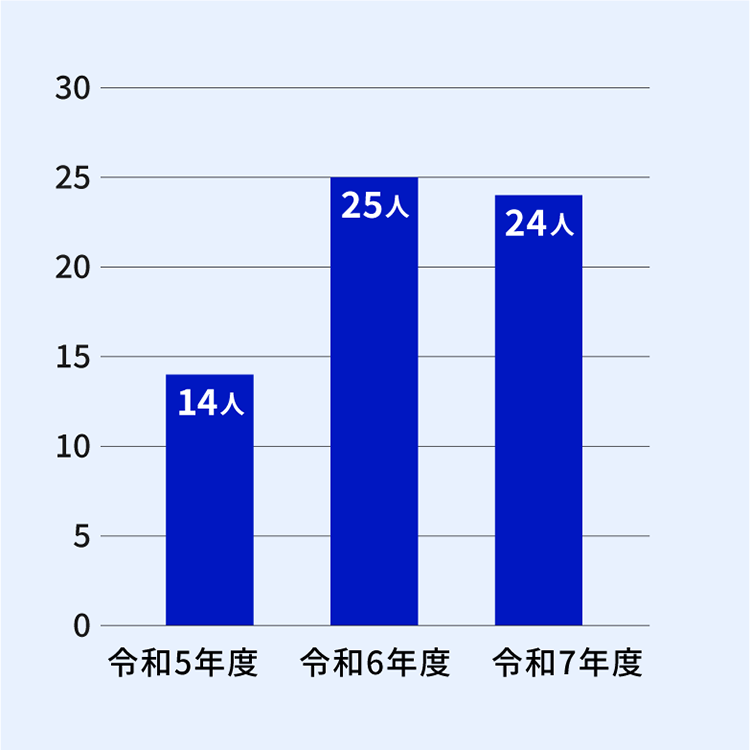
  • Hiring Results

    This is a table with the year of employment (2022 to 2008) as the row and the category of employment (career-track employee, university graduate, high school graduate, total for each year) as the column. 2022: career-track employee 5, general-track employee (university graduate) 4, general-track employee (high school graduate) 0, total for each year 9. 2023: career-track employee 6, general-track employee (university graduate) 8, general-track employee (high school graduate) 3, total for each year 17. 2024: career-track employee 11, general-track employee (university graduate) 6, general-track employee (high school graduate) 2, total for each year 19. 2025: career-track employee 8, general-track employee (university graduate) 10, general-track employee (high school graduate) 1, total for each year 19. 2026: career-track employee 7, general-track employee (university graduate) 9, general-track employee (high school graduate) 3, total for each year 19. Total for 5 years: career-track employee 37, general-track employee (university graduate) 37, general-track employee (high school graduate) 9, total for each year 83. Total values are highlighted in blue.

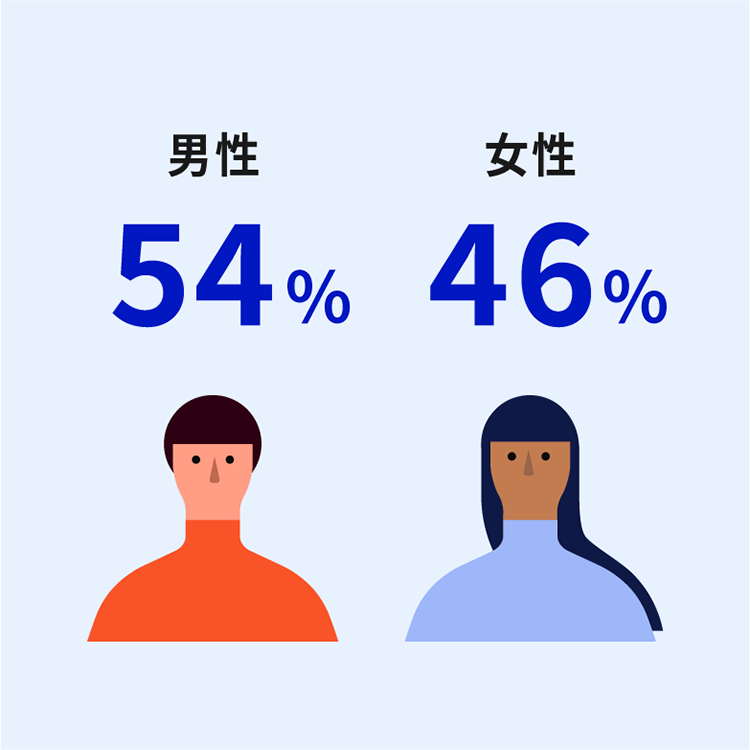
  • Male to female ratio
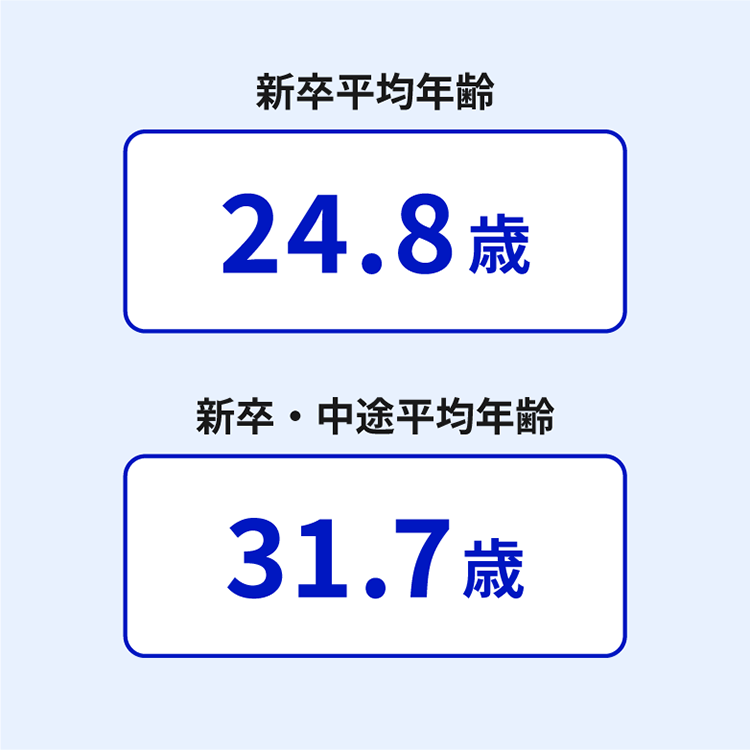
    On a light blue background, it shows "54% male" on the left and "46% female" on the right in large print. Below each number is a simple illustration of a man (orange top) and a woman (light blue top).

  • Average age

    On the light blue background, "average age of new graduates 24.8 years old" is shown in the upper row, and "average age of new graduates and mid-career workers 31.7 years old" is shown in the lower row, each surrounded by a dark blue rounded frame.

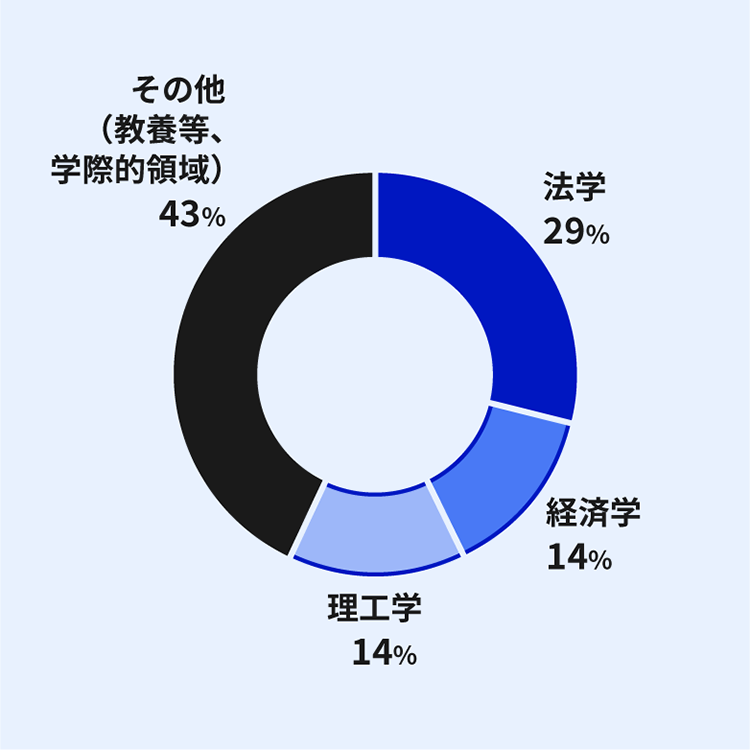
  • Examination Category for Graduate School Graduates in Comprehensive Service

    The doughnut circle graph shows the percentage of each major field in the examination categories for comprehensive service and graduate school graduates. Public administration is the largest at 59% (dark blue), followed by digital at 17% (medium blue), engineering at 12% (light blue), agricultural sciences and fisheries at 6% (black), and chemistry, biology, and pharmacy at 6% (gray). Public administration accounts for the majority, followed by science and engineering and digital.

  • Division of the Examination for Comprehensive Service University Graduate Level

    A doughnut circle graph showing the percentage of each major field in the career-track and university graduate level examination categories. Digital (dark blue), liberal arts (medium blue), and politics, international studies, and humanities each had the highest percentage of 21% (light blue), followed by economics at 16% (black), law at 16% (gray), and engineering at 5% (light gray).

  • Category of Examination for General Service University Graduate Level

    The doughnut circle graph shows the percentage of each major in the examination categories of general service and university graduate level. Public administration accounts for 57%, the majority (dark blue), followed by digital, electricity and electronics at 37% (medium blue). Liberal arts 3% (light blue) and agriculture 3% (black) are very few. The two fields of public administration and digital, electricity and electronics account for almost all of the total.

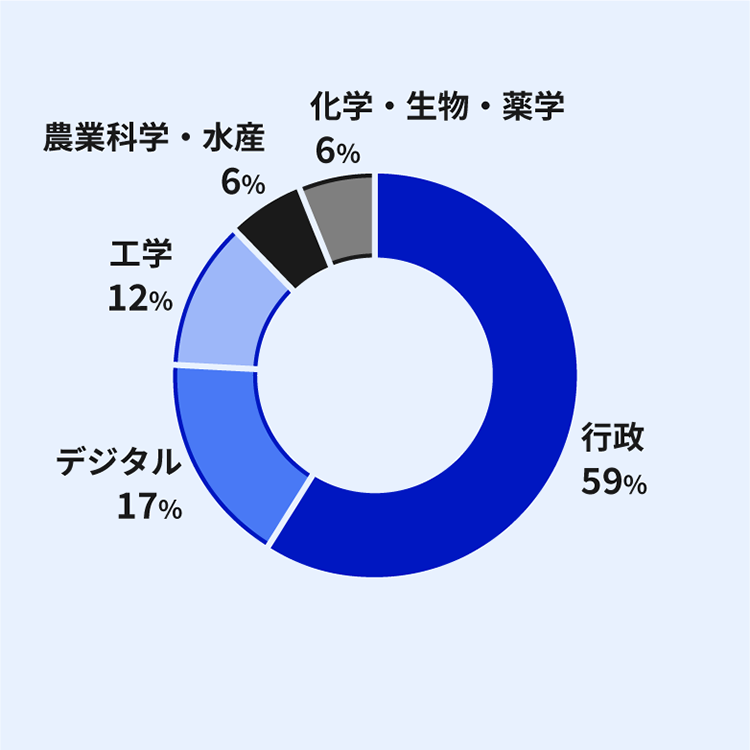
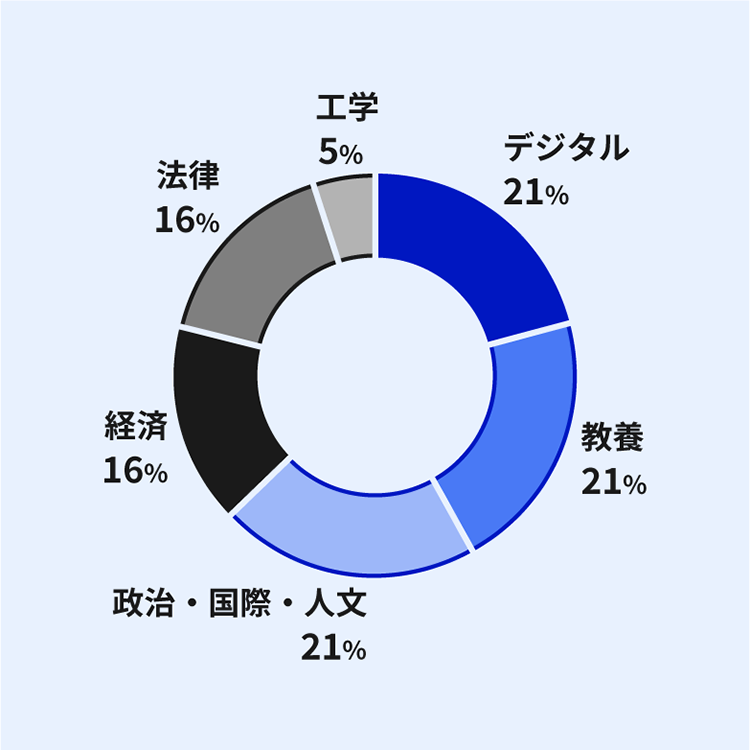
  • Major Field for Comprehensive Work (New Graduates Entering Graduate Offices in the 2026 Academic Year)

    The doughnut circle graph shows the percentage of new graduates entering the University in FY 2026 for career-track positions by field of study. The four fields are: others (liberal arts and interdisciplinary fields) 43% (black), law 29% (dark blue), economics 14% (medium blue), and science and engineering 14% (light blue). Humanities and interdisciplinary fields account for the majority.

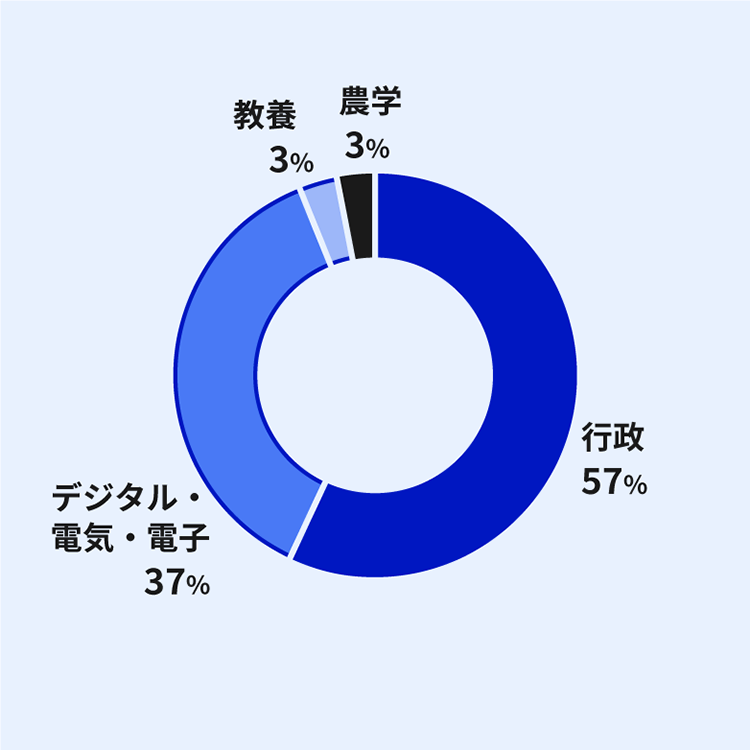
  • Clerical Staff Major Field (New Graduates Entering Graduate Offices in the 2026 Academic Year)

    A doughnut circle graph showing the percentage of new graduates entering the Agency in the 2026 academic year and regular employees by major field. It consists of five fields: 38% (gray) for others (liberal arts and interdisciplinary fields), 25% (dark blue) for law, 13% (medium blue) for agriculture, 12% (light blue) for engineering, and 12% (black) for science and engineering.

  • Turnover rate within three years

    Infographic showing that the turnover rate within three years after entering the office is 2.4%. Under the heading "Turnover rate within three years", "2.4%" is displayed in large size. At the bottom, a bar graph showing the overall rate is arranged in light blue, of which "2.4%" is displayed in dark blue. Design that visually emphasizes the low turnover rate.

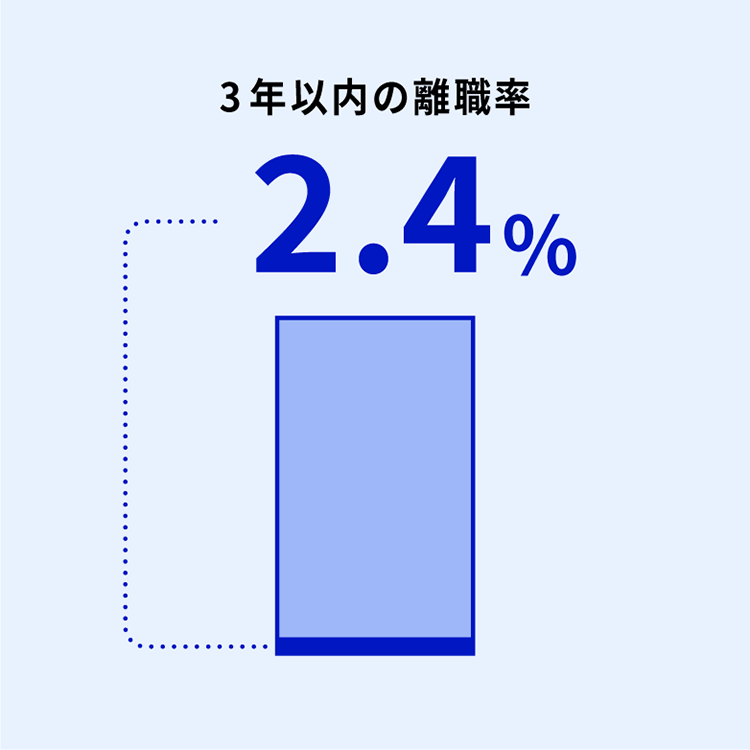
    • *Percentage of new graduates who left their jobs within three years of arrival

Know how to work

We will give you a picture in numbers about assignment and training after entering the Digital Agency, and balancing work and private life.

  • Four groups in Digital Agency

    This illustration shows the four organizational groups for Digital Agency. The four groups are vertically arranged with a light blue background and dark blue rounded borders. The groups are, from top to bottom: Group of Strategy and Organization, Group of Common Functions for Digital Society, Group of Service for Citizens, and Group of Service for Ministries Administration.
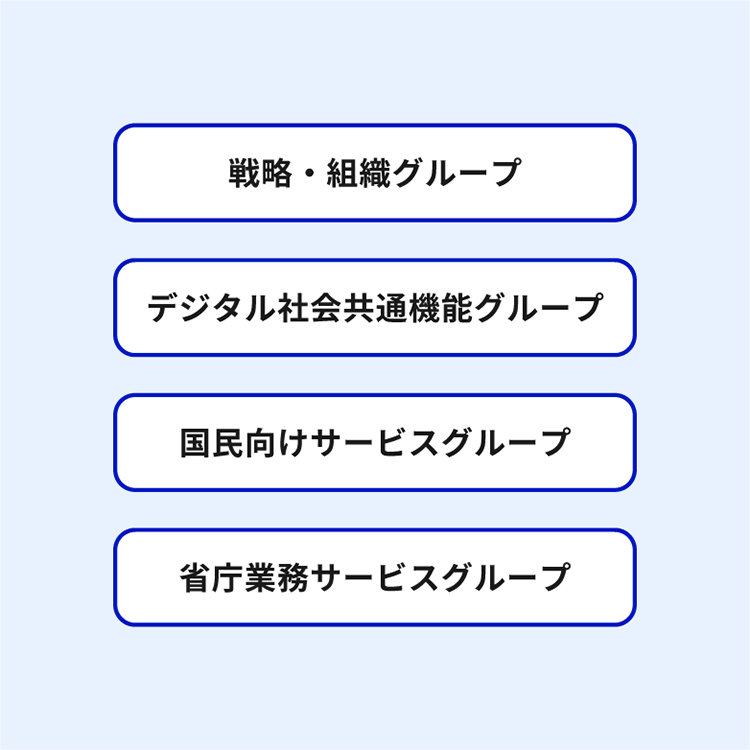
    After entering the office, you will be assigned to one of four groups.

  • Assignment of New Graduate Career-Track Employees

    The doughnut circle graph shows the distribution of new graduates by group, with Group of Strategy and Organization accounting for 35% (dark blue), Group of Service for Ministries Administration for 29% (medium blue), Group of Common Functions for Digital Society for 27% (light blue), and Group of Service for Citizens for 9% (black), indicating a relatively dispersed distribution among the four groups.
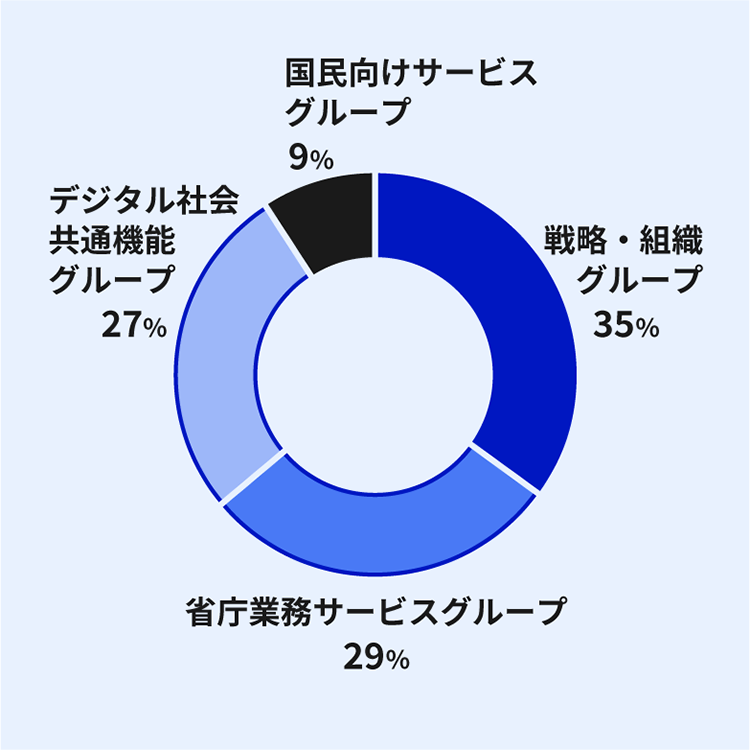
    By experiencing the work of the secretariat that oversees the entire agency and various projects in the Digital Agency, you will acquire the overall sense and sense of balance necessary for generalists.

  • Assignment of New Graduates to General Positions

    The doughnut-shaped graph shows the distribution of new graduates in managerial positions by group. Group of Strategy and Organization accounts for the overwhelming majority at 68% (dark blue), followed by Group of Service for Ministries Administration at 12% (medium blue), Group of Common Functions for Digital Society at 12% (light blue), and Group of Service for Citizens at 8% (black). Compared to career-track employees, the degree of concentration in Group of Strategy and Organization is remarkably high.
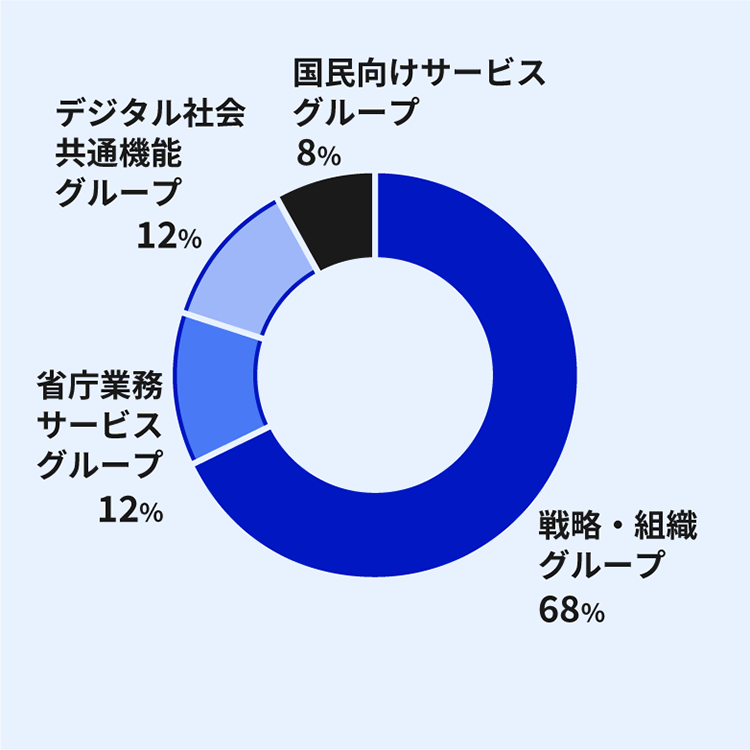
    In addition to experiencing secretariat work that supports the organization, such as accounting and human resources, they will engage in projects using their expertise and acquire the knowledge necessary as specialists.

  • Number of training courses for new employees

    A doughnut chart showing the breakdown of the number of training courses for new employees. "Total 33" is shown in the center. The chart consists of three categories: 18 specialized themes (dark blue), the largest number, 12 basic and business themes (medium blue), and three practical themes (light blue).
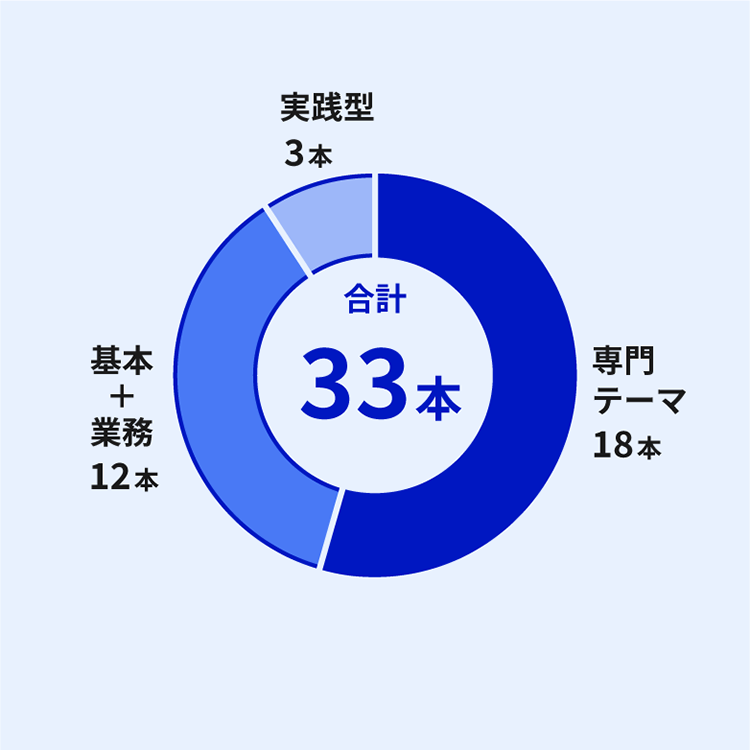
    After entering the Immigration Control Bureau, employees undergo a three week training period, during which they study in stages in parallel with their duties. The training covers everything from the basics to practical and specialized topics.

    • *Calculated based on Digital Agency employees who joined the Immigration Bureau in April 2026. The number of trainees differs slightly depending on the employment category.
  • Number of participants in English training

    Bar chart showing the number of English language trainees from 2023 to 2007. Composed of three vertical blue bars. 14 trainees in fiscal 2023, 25 in fiscal 2024 (maximum), and 24 in fiscal 2025. There was a significant increase of about 79% from fiscal 2023 to fiscal 2024, and the number remained almost unchanged in fiscal 2025. The vertical axis is a scale from 0 to 30.
    We offer cost-subsidized training for Digital Agency recruits to help them learn once they enter the agency.

    • *Held twice a year only in fiscal 2024 (total number of participants)
  • Ratio of Childcare Leave Taken by Gender (FY 2024)

    An infographic showing that both men and women took 100% of parental leave in 2024. Under the heading "100% for both male and female employees," it is largely labeled "100%." At the bottom is a simple illustration of a man wearing a red-orange top and a woman wearing a light blue top, each holding a baby in a blue sling. The design emphasizes that both men and women have achieved full parental leave.

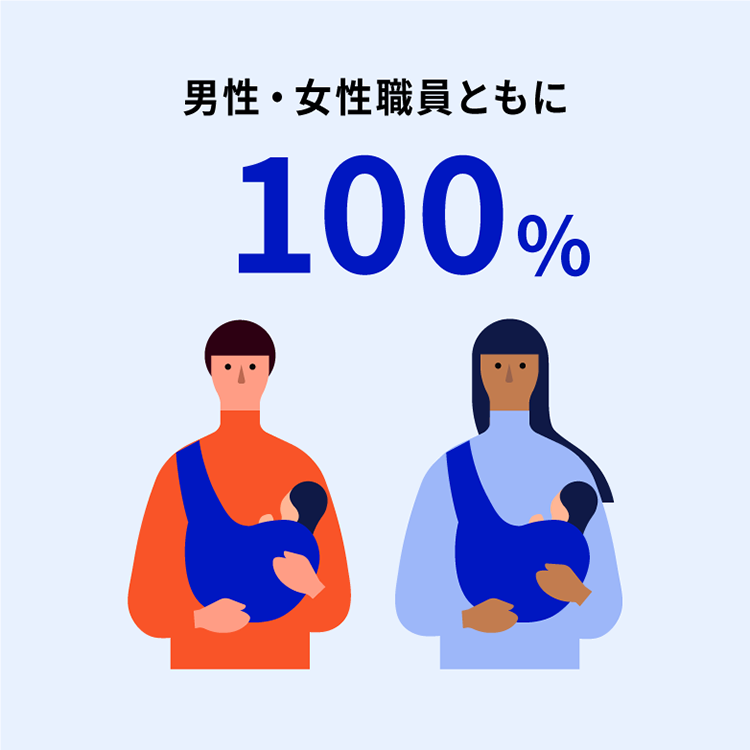
    • *For Digital Agency employees (including non-regular employees), the ratio of employees who newly took child care leave during the fiscal year to the number of employees who became able to take child care leave during the fiscal year.