Management Status Dashboard for Water Supply, etc.
- Last Updated:
Notice
- Data was updated on July 3, 2026.
Table of Contents
- About the Water Supply Business
1.1 Structure of Water Supply System
1.2 MIERUKA for Sustainable Water Supply Projects
1.3 Indicators of Water Supply Management - Business conditions throughout Japan
2.1 Annual Trends in Major Indicators in Annual trends in major indicators nationwide
2.2 Combined Status of Water Supply Systems in
2.3 Status of Water Supply Systems in
2.4 Annual Trends in Household Water Charges in Annual Trends in Household Water Charges - Management status of each water supplier
3.1 Annual Trends in Major Indicators of Water Suppliers, etc.
3.2 Comparison of Similar Organizations in Comparison of similar organizations - Points to Consider
- Contact Us
1. About the Water Supply Business
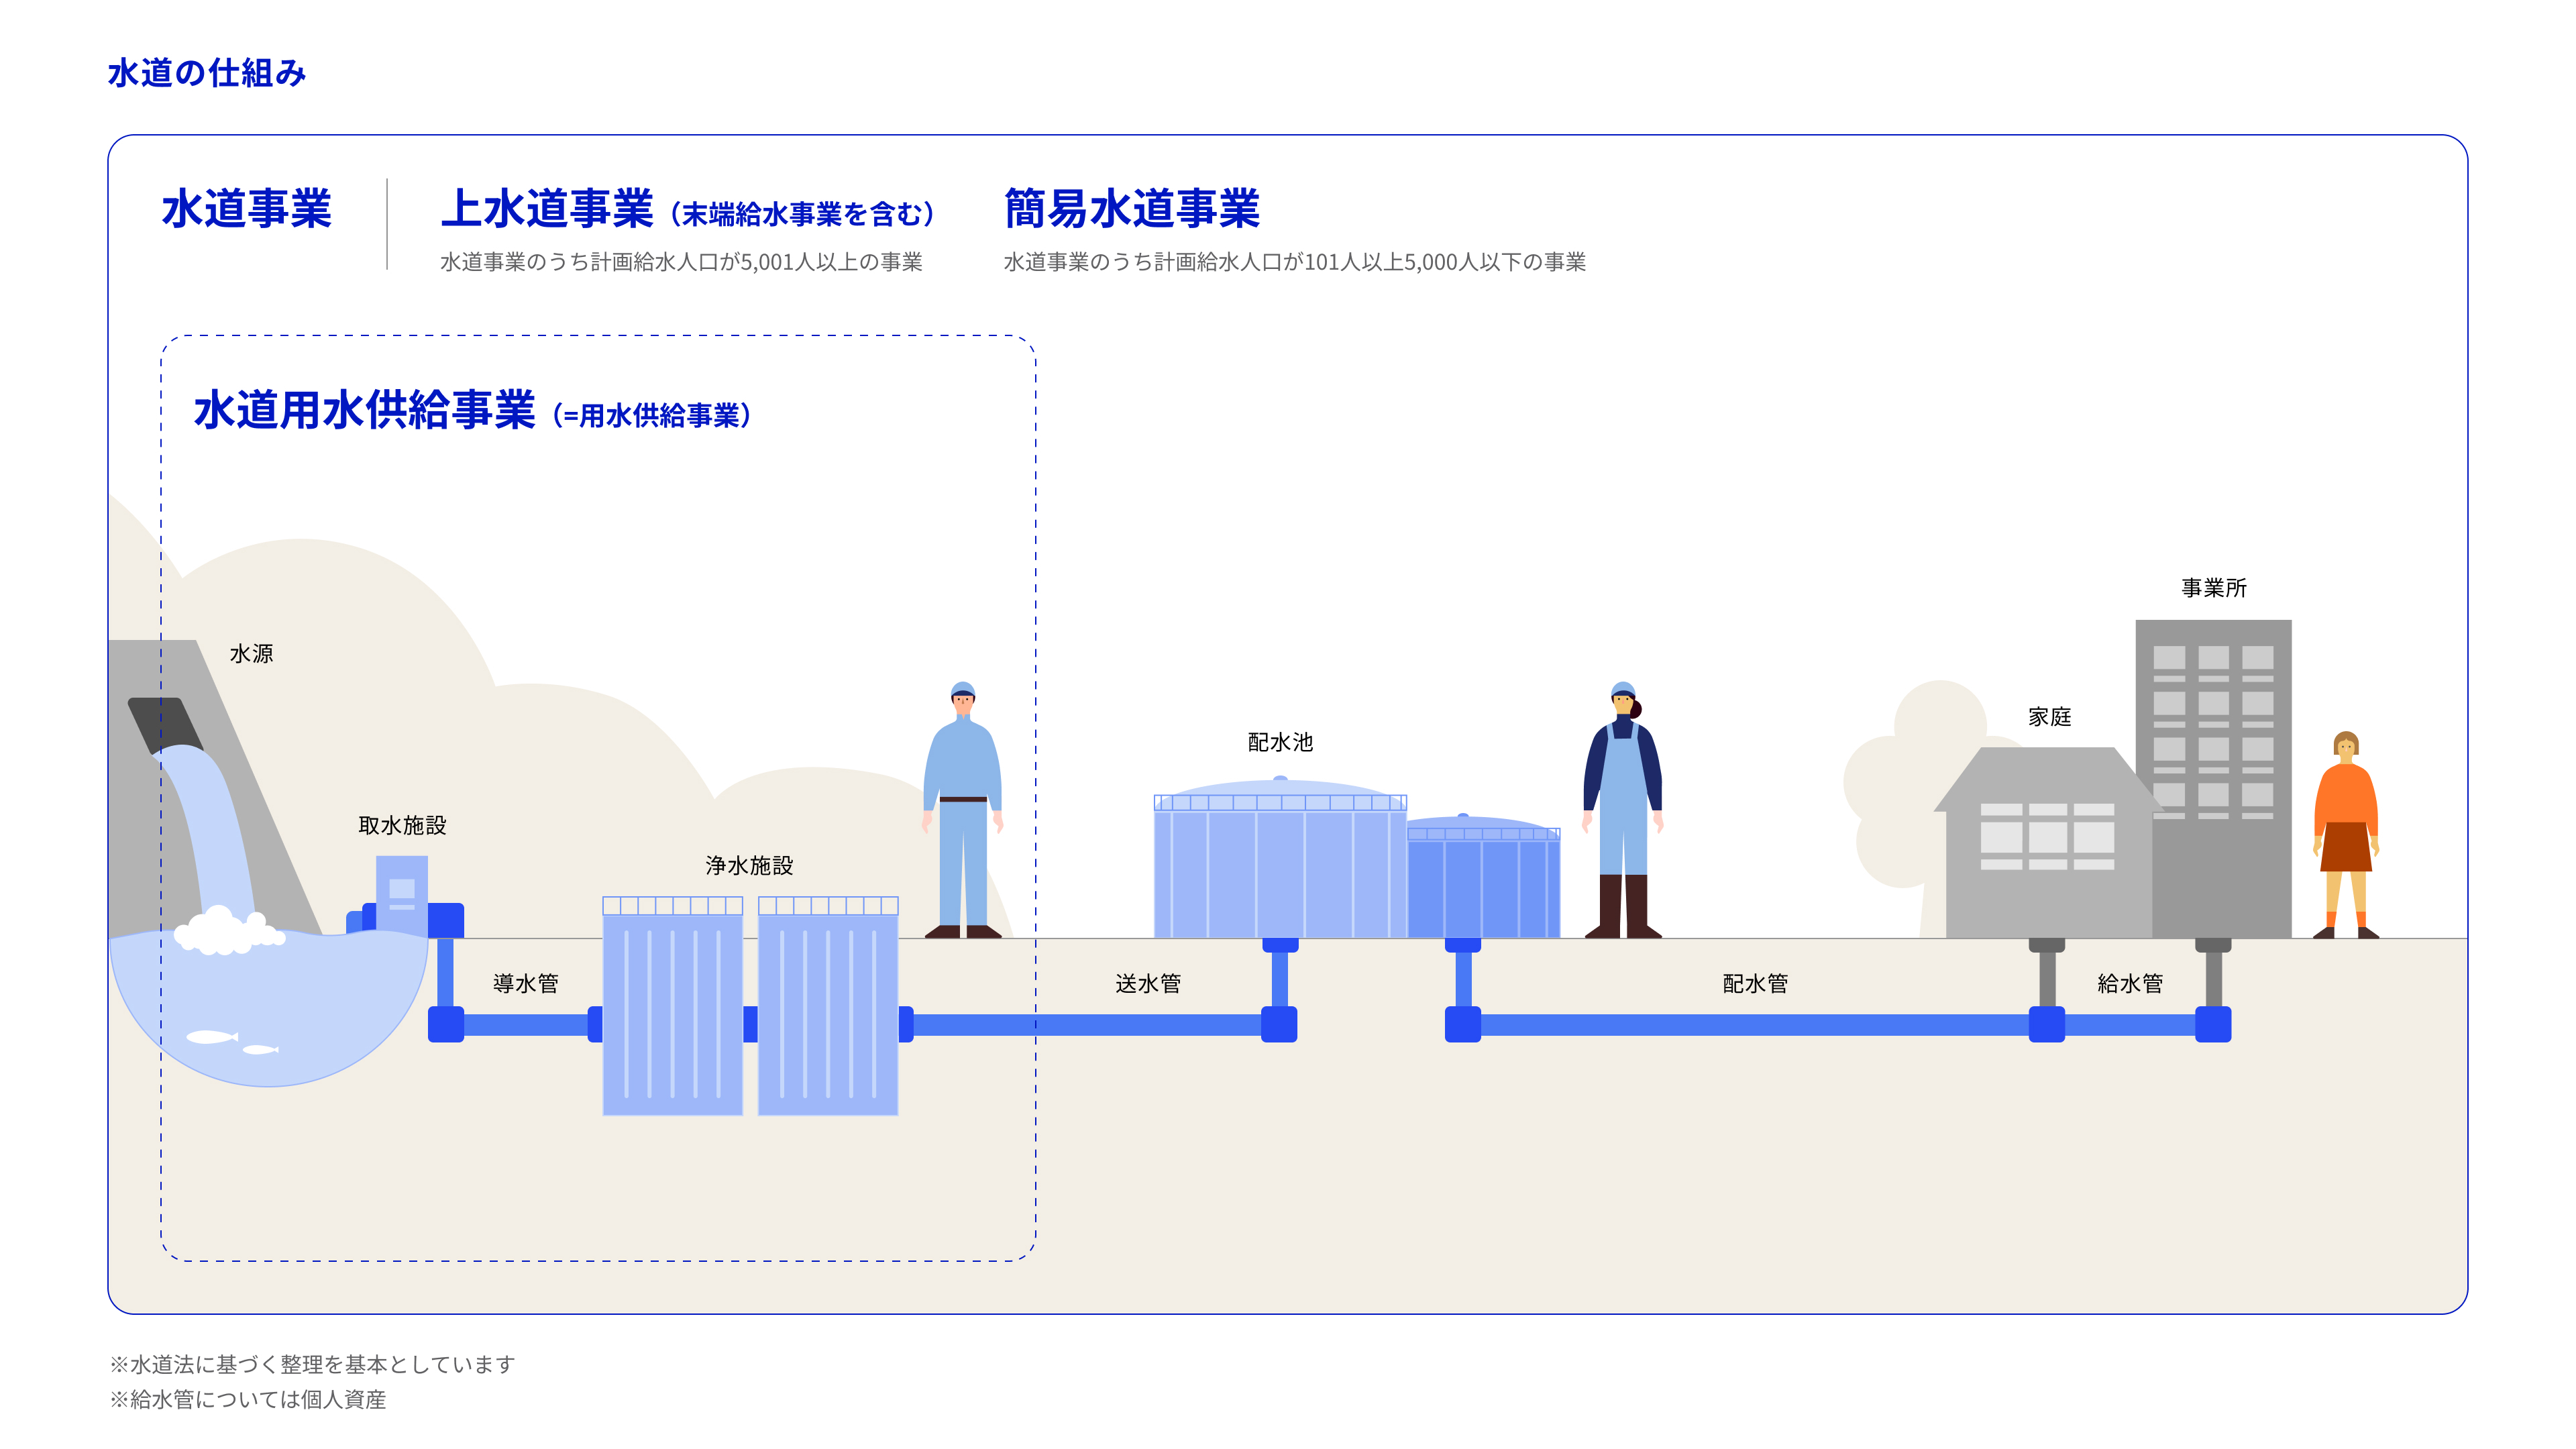
1.1 Mechanisms of Water Supply Projects
Waterworks mainly consists of two businesses to supply safe and secure tap water.
- Water supply business: A business that takes in water from rivers and dams, purifies it, and delivers it to households through distribution pipes, etc.
- Water supply business: A business that takes in water from rivers and dams, purifies it, and delivers it to water suppliers on behalf of the water suppliers.
The cooperation of these projects has created a system in which tap water can be used anywhere in the country.
*In this dashboard, water supply is included, so the expression "water supply, etc." is used for convenience.
1.2 MIERUKA for Sustainable Water Supply Projects, etc.
The operating environment for the waterworks and other businesses will become increasingly challenging in the future due to the aging of facilities, the decrease in on-site personnel, and the decline in income associated with the declining population. In order to continue to provide sustainable waterworks services for the future, it is essential to promote DX to transform working styles and operations.
Against this backdrop, Ministry of Internal Affairs and Communications, the Ministry of Land, Infrastructure, Transport and Tourism, and the City of Digital Agency have established a dashboard to provide an overview of the management status of water supply projects to employees involved in water supply projects. The dashboard is useful for discussing improvements, promoting initiatives, and explaining the management status of water supply projects.
- Progress of and Further Measures for Digital Administrative and Fiscal Reforms (Cabinet Secretariat) [PDF]
- Interim Report of the Water and Sewage Systems DX Promotion Study Group (PDF format)
1.3 Indicators related to the management of water supply, etc.
In order to realize sustainable management of water supply and other businesses, it is necessary to comprehensively grasp indicators related to facility conditions, such as aging, earthquake-proofing, and efficiency, from indicators related to financial conditions, such as profitability and asset management. The dashboard visualizes the following three indicators so that people involved in the management of water supply and other businesses can grasp the situation and perform comparative analysis.
- Basic information: Population and area supplied with water
- Financial status: Figures for rate collection rate, water supply cost, current ratio, etc.
- Status of facilities: Figures such as the aging rate of pipelines, the seismic adequacy rate, and the facility utilization rate

2. Business Conditions in Japan
2.1 Annual Trends in Major Indicators Nationwide
You can check the annual trend of major indicators related to water supply projects, etc. for Japan as a whole or for a specific prefecture. In order to give an overview of the status of water supply projects, etc., each indicator is shown as a total figure.
* Combined figures: Weighted averages, medians, and distributions for all businesses are selected based on the appropriateness of each indicator. For details on each figure, see " Data Definition ."
2.2 Combined Status of Water Supply Projects, etc. in Each Prefecture
You can check the combined figures for water supply and other services in each prefecture.
The indicators on the X-axis and Y-axis of the scatter graph and the indicators in the table can be changed to any indicators. By viewing the status of each prefecture in distribution or arranging them, you can grasp the status of water supply projects from multiple perspectives. You can also see the water supply operators in the prefecture selected in the table.
2.3 Status of Water Supply Projects in Prefectural Governments
You can check the individual figures of all the water works under the selected prefecture.
The indicators on the X-axis and Y-axis of the scatter diagram and the indicators in the table can be changed to any indicators. By viewing the status of each business in distribution or arranging them side by side, you can understand the differences in the status of each water supply business as objective facts. You can also view the time-series trends of water supply operators, etc. selected in the table.
2.4 Annual Trends in Domestic Water Charges
You can see the level of domestic water charges of water suppliers across the country.
You can also see the magnitude of changes or differences over time.
3. Business conditions of each water supplier, etc.
3.1 Annual Trends in Major Indicators of Water Suppliers, etc.
You can check the annual trend of the main indicators of selected water suppliers, etc.
3.2 Comparison of Similar Organizations
You can switch between the three tabs of "Financial Status," "Expense Breakdown," and "Status of Facilities" to compare the figures of the selected water suppliers, etc. and similar organizations with the latest fiscal year and annual trends. You can also check the figures of each indicator with the business operators belonging to the similar organization category from "See similar organizations ->".
- Viewing "Comparison of Similar Management Organizations in the Water Supply Industry" in Full Screen
4. Important Points
Data:
Various information used in the dashboard is collected by the Ministry of Land, Infrastructure, Transport and Tourism and Ministry of Internal Affairs and Communications.
- Results of Emergency Inspection of Earthquake-Resistant Water and Sewage Facilities (MLIT)
- Survey on the Financial Status of Local Public Enterprises (Ministry of Internal Affairs and Communications)
These data are put together and published together as structured data for dashboards.
- Conveyance Data-The Datatable (ZIP / 6,454 kb) (updated July 3, 2026)
- Vertical holding Date: DataTable _ CSV format (ZIP / 11,808 kb) (updated July 3, 2026)
Defining Data
See below for a definition of data.
Refresh Data
We plan to update the various dashboard numbers on a regular basis.
True or false information
For true-or-false information about the statistics in this dashboard, see True-or-False: Dashboard on the Health of Water Utilities .
5. Inquiries
- *"@" is displayed as "
_ atmark _" to prevent spam mail. When you send mail, please change "_ atmark _" to "@" (one byte).
Inquiries concerning this dashboard
- Water Supply and Sewerage Planning Division, Deputy Director-General Group, Water Management and National Land Conservation Bureau, Ministry of Land
- Telephone: 03 5253 8428
- Email: hqt-kanrikikaku _ atmark _ gxb. mlit. go. jp
Inquiries about the "Survey on the Financial Results of Local Public Enterprises" and the "Business Comparison Analysis Table"
- Ministry of Internal Affairs and Communications Municipal Enterprise Management Office
- Email: koueigiyo. suido _ atmark _ soumu. go. jp